Download
1 / 35
420 likes | 720 Vues
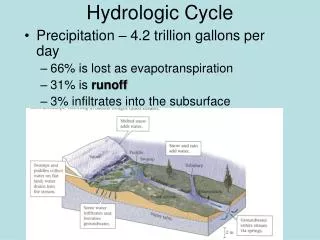
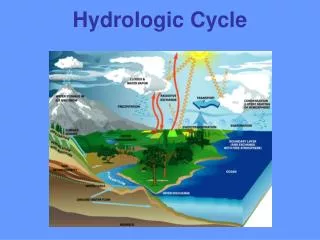
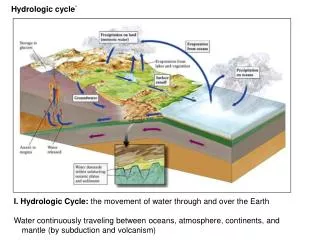
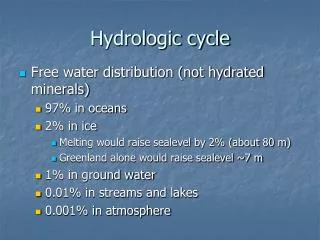
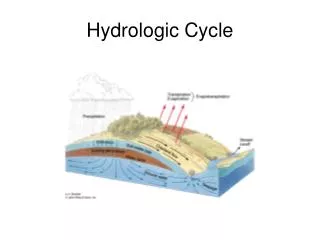
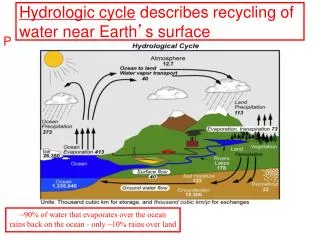
Hydrologic cycle describes recycling of water near Earth ’ s surface. P. ~90% of water that evaporates over the ocean rains back on the ocean - only ~10% rains over land. Fig. 5.15. P. Size of Reservoirs. S. Table of reservoir sizes. P. Comparison of river Water and ocean water.

E N D
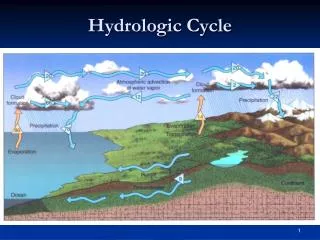
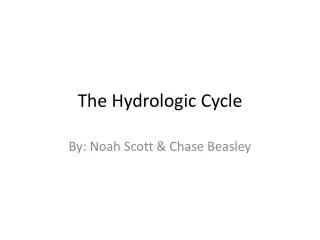
Hydrologic cycle describes recycling of water near Earth’s surface P ~90% of water that evaporates over the ocean rains back on the ocean - only ~10% rains over land Fig. 5.15
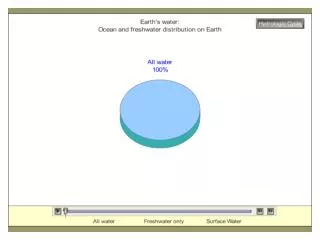
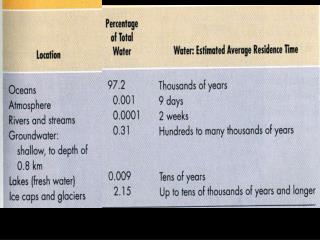
P Size of Reservoirs
S Table of reservoir sizes
P Comparison of river Water and ocean water They don’t balance -WHY?
P Flux (output) Flux (input) Reservoir Source Sink Ocean Reservoir (dissolved CO2) Source (atmospheric CO2) Sink (carbonate shells To sediments) The concept of reseviors, sources and sinks
S Flux (output) Flux (input) Reservoir Source Sink Bank Account (Balance) Source (Deposits) Sink (Withdrawals) A common example of a reservoir, sources And sinks
P Sources and Sinks of Dissolved Substances SOURCES SINKS River input Volcanic infiltrations Precipitation Adsorption Hydrothermal vents Sea spray Volcanic eruptions Biological processes Dust
P A diagram of sources and sinks of Dissolved substances in the oceans
P Residence time • Average length of time a substance remains dissolved in seawater • Assumes steady state condition • Ions with long residence time are in high concentration in seawater • Ions with short residence time are in low concentration in seawater 504
S Major Processes Affecting Residence Times Chemical reactions Biological demand Input from mid-ocean spreading centers Input from rivers
S Flux (output) Flux (input) Reservoir Source Sink Reservoir (dissolved CO2) Source (atmospheric CO2) Sink (carbonate shells To sediments) The ocean as a reservoir of carbon dioxide
P The shorter the residence, the more reactive the element
S Residence Time of Water TOTAL AMOUNT OF WATER IN OCEAN = 40,000 years AMOUNT ADDED FROM RIVERS PER YEAR THE ABOVE DIVISION GIVES YEARS AND IS THE RESIDENCETIME FOR WATER IN THE OCEAN RESERVOIR. RIVERS COULD FILL THE OCEAN IN 40,000 YEARS, A VERY SHORT TIME GEOLOGICALLY
P There are unreactive constitiuents with long residence times AND reactive ones with short residence times
S 501 A plot of the previous table
S The Dead Sea
S Location of the Dead Sea
S A table comparing these three hypersaline bodies of water
P Relative to nitrogen, there is much more oxygen and carbon dioxide dissolved in seawater
P Solubility of Gases Solubility increases as temperature decreases Solubility increases as pressure increases The relationship among temperature, pressure And solubility of gases
13_01 P Photosynthesis produces oxygen, Respiration uses up oxygen
Processes that affect oxygen concentrations
P Oxygen minimum Dissolved oxygen vertical profile
P Where deep water with high oxygen comes from
P Oxygen minimum Carbon dioxide vertical profile
S Carbonate buffering • Keeps ocean pH about same (8.1) • pH too high, carbonic acid releases H+ • pH too low, bicarbonate combines with H+ • Precipitation/dissolution of calcium carbonate CaCO3 buffers ocean pH • Oceans can absorb CO2 from atmosphere without much change in pH
Carbonate buffering S Fig. 5.18
P Carbonate equilibrium buffers seawater against large changes in pH
S pH scale
S Global surface pH