Download
1 / 10
100 likes | 197 Vues
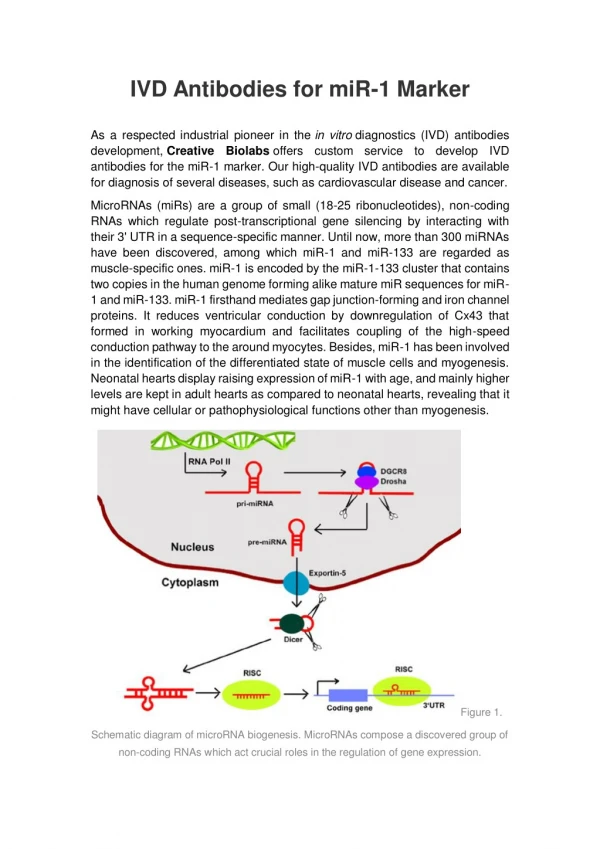
Explore the impact of miR-206 and miR-29 on gene expression in RMS cells through Western blot, qRT-PCR, and functional assays. Discover insights into apoptosis, proliferation, and cell cycle regulation in RMS. Investigate the regulatory roles of PAX3, CCND2, and E2F7 with luciferase reporter assays. Delve into myogenesis gene expressions before and after miR-29 transfection.

E N D
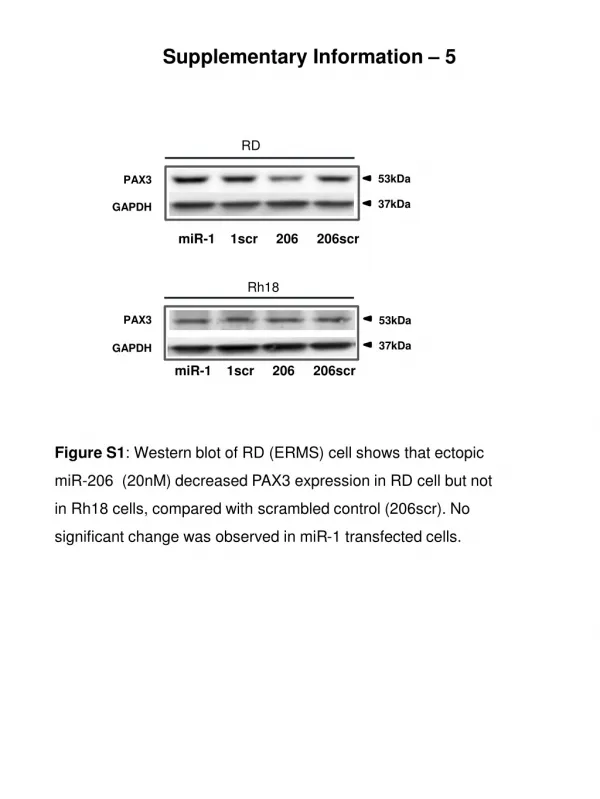
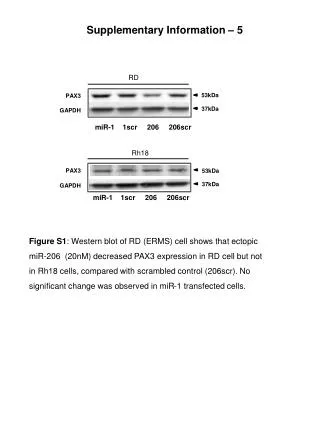
Supplementary Information – 5 RD 53kDa PAX3 37kDa GAPDH miR-1 1scr 206 206scr Rh18 PAX3 53kDa 37kDa GAPDH miR-1 1scr 206 206scr Figure S1: Western blot of RD (ERMS) cell shows that ectopic miR-206 (20nM) decreased PAX3 expression in RD cell but not in Rh18 cells, compared with scrambled control (206scr). No significant change was observed in miR-1 transfected cells.
A B figure S2: A) qRT-PCR on Rh30 cells shows that transfection with miR-1/-206 precursors (pre) but not scrambled controls (scr) result into increased expression of miR-1/-206. B) qRT-PCR on JR1 and Rh30 cells validate successful transfection of miR-29 precursors.
RD 34kDa CCND2 37kDa GAPDH Sham 29a 29b 29c mimic ctrl Rh18 CCND2 34kDa GAPDH 37kDa Sham 29a 29b 29c mimic ctrl Figure S3: Western blot shows that ectopic miR-29a /b/c (20nM) decreased CCND2 expression in RD (ERMS) cells, compared with sham control or negative miRNA precursor control. While in Rh18 (ARMS) cells, transfection of miR-29c but not miR-29a/b down regulated CCND2 expression compared with controls.
RD E2F7 97kDa 37kDa GAPDH Sham miR-29a miR-29b miR-29c mimic ctrl Rh18 E2F7 97kDa 37kDa GAPDH Sham miR-29a miR-29b miR-29c mimic ctrl Figure S4: Western blot of RD (ERMS) cell and Rh18 (ARMS) cell. Ectopic miR-29c / -29a (20nM) decreased E2F7 expression in Rh18 cells, compared with sham control or negative miRNA precursor control. No significant change was found in RD cells.
A (i) (ii) (iii) (iv) (v) B C (i) (ii) (iii) (iv) (v) Figure S6a: Functional assays in Rh30 cells transfected with miR-29a, -29b, or -29c (20nM). Apoptosis assay (A) showed significant pro-apoptotic effect of miR-29a (ii), -29b (iii) or -29c (iv) in serum-starved Rh30 compared to negative miRNA control (i). Proliferation assay (B) showed no significant effect caused by individually transfected miR-29 family members. Cell cycle assay (C) showed no significant changein Rh30 cells transfected with miR-29a (ii), -29b (iii) or -29c (iv) compared to negative miRNA control (i). Data are shown in (v). Negative miRNA precursor control#1 (Ambion, 20nM) serves as control.
A (i) (ii) (iii) R-PE R-PE SYTOX SYTOX B C (i) (ii) (iii) Figure S6b : Cell function assay of Rh30 cells transfected with combined miR-29a, -29b, and -29c (10nM for each). A) Apoptosis assay shows pro-apoptotic effect in miR-29 transfected Rh30 cells (ii) compared to control cells (i), and data are presented in (iii). B) Proliferation assay show no effects of combined miR-29 family members transfected Rh30 cells compared to control cells. C) Cell cycle assay shows mild G1 arrest (ii) compared to control (i), and data are showed in (iii).
1948 -2119 1948 CAGTGGTCCC AATAGGAGAC AAAGGAGAGT GATTGATTTT 1987 1988 CTTCCTCCAA TAGTTGGTTT CAAATCCTTT TGAACACGTT 2027 2028 CGACAAAAGC AGTGGAGAAG AGGAAGACCT GGAGCAATAA 2067 2068 AAGACAAATG CAACATTTTA AGGCAATGGT TTCACATGGT 2107 2108 TACATATCAA AA 2119 Figure S7a: Deletion in PAX3 3’UTR in JR1 (ERMS) cells. Sequencing electropherogram of the PAX3-3’UTR sequence points the deletion site and the deleted sequence in the 3’UTR is shown in the inset.
PAX3 transcript Sequence that does not showing here Coding: 382-1833 3’UTR: 1834-3356 2158 and 3133: miR-1/206 binding sites Missing regions Mutation Translocation Figure S7b: Schematic figure showing the 5’ terminus of 3’UTR of PAX3 transcript in RMS cells as well tissue samples. A)~E) According to the sequencing result, most of the missing regions happen among the 1830-2127 of transcript variant I. This region, so called “hot zone”, is around 31-156 nts upstream of the first miR-1/206 binding site (2158). Sequencing result also show that F) point mutations. G) shorter transcript. H) Fusion PAX3-FOXO1 due to translocation t(2,13)
* * * * * Figure S7c: Luciferase reporter assay show that the lucifrease expression from wildtype PAX3 3’UTR sGG vector (WT) is repressed due to co-transfected miR-1/-206, and the deletion mutant PAX3 3’UTR which missing the 1948-2119nt region manages an escaping from the repression of miR-1/-206, while another deletion mutant which missing the1830-2002nt region fails to do so.
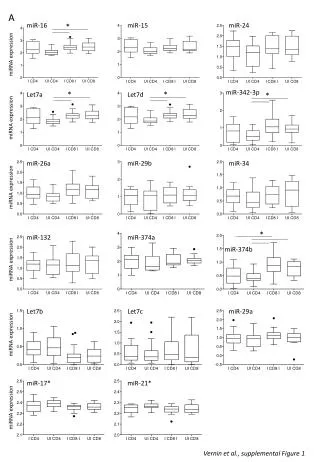
* * * * ctrl 29a 29b 29c ctrl 29a 29b 29c ctrl 29a 29b 29c ctrl 29a 29b 29c JR1 Rh30 RD Rh18 * * * * ctrl 29a 29b 29c ctrl 29a 29b 29c ctrl 29a 29b 29c ctrl 29a 29b 29c JR1 Rh30 RD Rh18 Figure S8: Transcript level of myogenesis genes including alpha actin, myogenin, myoD1 and troponin T were checked with realtime PCR in RMS cells before and 48h after miR-29 transfection. Among them, α actin was increased after miR-29 transfection in Rh30 and RD cells, and myogenin was up-regulated after ectopic expression of miR-29 in RD cells. We noticed that there was no expression of myogenin in both ARMS cell lines with (Rh30) or without (Rh18) PAX3-FOXO1 translocation. * p<0.05, vs negative miRNA precursor control.