Clustering Analysis of Mutants in UPLC-MS Reveals Distinct Metabolite Profiles
This study utilizes Principal Component Analysis (PCA) to examine the metabolic differences between various mutant strains and the wild type (WT) in UPLC-MS data. The clustering results indicate clear separations between the WT and mutants, with distinct clusters observed for the different mutant populations. The analysis highlights specific metabolites, including various glucosinolates and fatty acids, which demonstrate differential accumulation patterns. Additionally, S-plots illustrate how mutant metabolites differ from the WT, providing insights into potential metabolic pathways affected by mutations.

Clustering Analysis of Mutants in UPLC-MS Reveals Distinct Metabolite Profiles
E N D
Presentation Transcript
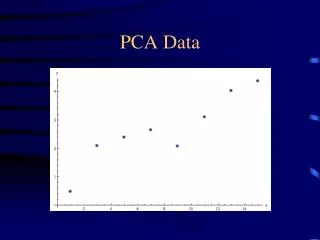
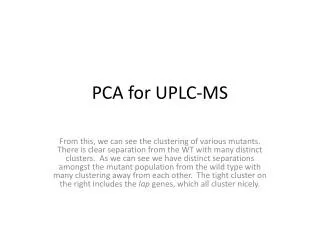
PCA for UPLC-MS From this, we can see the clustering of various mutants. There is clear separation from the WT with many distinct clusters. As we can see we have distinct separations amongst the mutant population from the wild type with many clustering away from each other. The tight cluster on the right includes the lap genes, which all cluster nicely.
2000 A A Wild Type A T V T V 1000 T V X P X X 1 1 M M 1 M P E 5 5 P 3 3 5 2 3 E L Z E Z Z W W 0 2 G I W PC2 O D 4 L L D O 4 4 G I G U O 2 Y I U Y D Y F U S S Q C S C R N Q Q N R N R F C F B B B H H H -1000 K K K J J -2000 J -2000 -1000 0 1000 PC1
HCA dendogram for UPLC-MS If you will zoom out you can get a better visual. The scale is from blue (low accumulation) to red (high accumulation).
127-1-1_3 127-1-1_1 127-1-1_2 155-2-1_2 155-2-1_3 155-2-1_1 103-3-2_1 103-3-2_3 103-3-2_2 12-1-2_2 12-1-2_3 12-1-2_1 55-1-1_3 55-1-1_2 55-1-1_1 52-4-2_2 110-2-1_2 52-4-2_1 110-2-1_1 52-4-2_3 110-2-1_3 155-2-1_2 154-1-1_2 131-1-2_2 131-1-2_1 131-1-2_3 155-2-1_3 154-1-1_3 155-2-1_1 154-1-1_1 137-2-1_3 137-2-1_1 137-2-1_2 135-2-3_1 135-2-3_3 135-2-3_2 62-1-1_3 24-1-1_2 24-1-1_3 24-1-1_1 119-1-1_2 119-1-1_1 119-1-1_3 At1g33430_1 At1g33430_3 At1g33430_2 At1g65060_3 At1g65060_1 At1g65060_2 62-1-1_1 62-1-1_2 47-3-1_3 16-3-1_3 52-1-1_2 52-1-1_1 52-1-1_3 40-4-1_1 40-4-1_2 40-4-1_3 15-3-2_3 15-3-2_1 15-3-2_2 47-3-1_2 16-3-1_2 47-3-1_1 16-3-1_1 28-3-1_2 28-3-1_3 28-3-1_1 Lap4_2 Lap4_3 Lap4_1 At3g28780_1 At3g28780_3 At3g28780_2 Lap6-2_3 Lap6-2_1 Lap6-2_2 Lap5_1 Lap5_2 Lap5_3 Lap6_3 Lap6_1 Lap6_2 Lap5-6_2 Lap5-6_1 Lap5-6_3 Lap3_1 Lap3_3 Lap3_2 WT WT WT 4-hydroxy-3-indolylmethyl-glucosinolate_447.0528_2.4498 8-Methylsulfinyl-n-octyl glucosinolate _492.1012_3.1709 1-16:0-lysophosphatidylethanolamine_452.2789_24.1954 kaempferol 3-glucoside-7-p-coumaryl-glucoside_755.2034_3.8868 4-Methylsulfinyl-n-butyl-glucosinolate_436.039_0.6921 6-Methylsulfinyl-n-heyl-glucosinolate _464.0702_1.308 7-(methylsulfinyl)-heptyl-glucoside_478.0882_2.0476 isorhamnetin 3-glucoside-7-rhamnoside_623.1606_5.9036 1-18:3-lysophosphatidylethanolamine_474.2643_21.9428 Baicalein 7-O-glucuronide_445.0768_5.7048 Leteolin 3'-methyl ether 7-glucoside _461.1067_8.1826 kaempferol 3-glucoside-7-galacturonide_607.1662_6.8962 kaempferol-3-rhamnoside-7-rhamnoside_577.1549_6.5228 Naringenin chalcone_271.0588_10.3893 luteolin-3-7-di-O-glucosinolate_609.1452_4.8089 Kaempferol Hexose _416.1053_7.0031 Indol-3-ylmethyl-glucosinolate_447.0536_1.3604 10,16-dihydroxypalmitic acid_287.2221_14.2284 Palmitoleic acid_253.2165_29.7395 kaempferol-7-O-glucoside _447.0926_7.5553 Linolenic acid _277.2165_28.2305 Palmitic acid_255.2308_31.7811 luteolin-7-O-rhamnoside_593.1513_6.1882 Linoleic acid_279.2322_30.418 Naringenin_271.0585_9.9375 Oleic acid_281.2478_32.0921 Unknown _223.0263_14.0477 Unknown_265.1476_26.6734 Unknown_293.1778_33.0769 Unknown_321.2108_33.8278 Unknown_388.2698_12.2189 Unknown_375.2751_13.3403 Unknown_504.3098_23.7926 Unknown_344.2449_15.1693 Unknown_305.0806_13.9126 Unknown_315.1122_17.5205 Unknown_502.2924_21.4499 Unknown_504.3092_23.0687 kempferol-3-O-rutinoside _593.1503_5.555 Unknown_360.2372_8.6695 Unknown_342.229_13.0975 Unknown_476.277_23.6657 Unknown_445.077_5.0285 Unknown_480.3089_24.86 Isoscoparine_477.1029_6.9831 Unknown _881.5466_11.7747 Unknown_967.5861_11.9341 Unknown_793.4942_12.0488 Unknown_879.5295_12.1241 Unknown_749.4655_12.5328 Unknown_703.4233_12.6914 Unknown_611.3424_14.3943 Unknown_615.3735_13.0931 Unknown_595.3454_15.5652 Unknown_595.3503_15.8132 Unknown_593.3353_16.2731 Unknown_791.4764_12.379 Unknown_502.295_22.064 Robinin_739.2076_4.3732
S-plots for 4 mutants against wild type This shows what metabolites differ from the WT and mutant. WT is differences are show in Quadrant-IV while the mutant metabolites are represented in Quadrant-II
S-Plot (WT = -1, 15-3-2 (C) = 1) 28 25 35 33 29 44 42 46 52 1.0 26 39 41 34 43 27 36 23 48 55 50 58 57 59 37 40 54 56 30 53 51 24 18 14 49 45 38 12 32 22 21 19 0.9 47 0.8 0.7 31 0.6 0.5 0.4 0.3 0.2 0.1 p(corr)[1]P (Correlation) 0.0 -0.1 -0.2 -0.3 -0.4 -0.5 20 -0.6 3 -0.7 -0.8 -0.9 7 17 1 15 5 16 13 11 10 6 4 9 8 2 -1.0 -0.0003 -0.0002 -0.0001 0.0000 0.0001 0.0002 0.0003 CoeffCS[2](Group) (X Effects)
S-Plot (WT = -1, Lap6 (I) = 1) 34 28 33 36 46 48 42 50 1.0 39 35 41 43 55 54 59 37 25 53 29 51 14 40 57 49 56 32 26 23 27 24 44 21 45 38 52 22 58 0.9 47 19 0.8 30 0.7 0.6 20 0.5 31 0.4 0.3 0.2 0.1 18 p(corr)[1]P (Correlation) 0.0 -0.1 -0.2 12 -0.3 -0.4 -0.5 -0.6 -0.7 1 3 2 7 -0.8 4 17 -0.9 15 11 8 16 5 10 6 13 9 -1.0 -0.0003 -0.0002 -0.0001 0.0000 0.0001 0.0002 0.0003 CoeffCS[2](Group) (X Effects)
S-Plot (WT = -1, 127-1-1 (J) = 1) 34 23 36 39 44 12 48 50 59 1.0 35 37 43 46 52 53 51 54 58 49 28 45 18 42 40 33 47 0.9 41 0.8 0.7 0.6 0.5 14 55 0.4 0.3 0.2 0.1 p(corr)[1]P (Correlation) 0.0 57 -0.1 -0.2 -0.3 5 29 -0.4 10 25 -0.5 -0.6 6 -0.7 26 24 30 -0.8 56 -0.9 27 31 21 38 32 1 19 2 7 22 9 8 20 11 17 4 15 13 16 3 -1.0 -0.0002 -0.0001 0.0000 0.0001 CoeffCS[2](Group) (X Effects)
S-Plot (WT = -1, 110-2-1 (V) = 1) 26 33 34 28 25 27 29 44 46 50 52 1.0 30 32 35 37 39 43 12 48 58 19 24 41 42 14 51 18 49 40 59 45 38 47 20 0.9 31 0.8 0.7 7 0.6 0.5 0.4 54 17 0.3 0.2 0.1 p(corr)[1]P (Correlation) 0.0 -0.1 -0.2 -0.3 -0.4 23 -0.5 10 5 -0.6 9 22 -0.7 36 21 -0.8 13 -0.9 16 53 56 55 57 2 11 1 6 8 4 15 3 -1.0 -0.0003 -0.0002 -0.0001 0.0000 0.0001 0.0002 CoeffCS[2](Group) (X Effects)