Structure, evolution and dynamics of gene regulatory networks
530 likes | 707 Vues
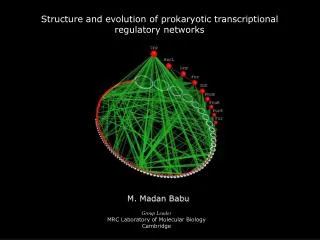
Structure, evolution and dynamics of gene regulatory networks. M. Madan Babu. Group Leader MRC Laboratory of Molecular Biology, Cambridge. Network. Metabolic. Protein Interaction. Transcriptional. Proteins. Nodes Links. Metabolites. Transcription factor Target genes. Enzymatic

Structure, evolution and dynamics of gene regulatory networks
E N D
Presentation Transcript
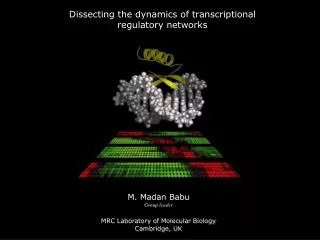
Structure, evolution and dynamics of gene regulatory networks M. Madan Babu Group Leader MRC Laboratory of Molecular Biology, Cambridge
Network Metabolic Protein Interaction Transcriptional Proteins Nodes Links Metabolites Transcription factor Target genes Enzymatic conversion Physical Interaction Transcriptional Interaction Protein-Protein Protein-Metabolite Interaction Protein-DNA A A A A B B B B Networks in Biology
Molecular Level Molecules & regulation Discover new features of regulatory systems Predicting function of novel regulatory proteins Molecular Cell (2008) Nuc. Acids. Res (2006) J Bacteriol (2008) Systems Level Systems & regulation Principles of regulation for cellular homeostasis Principles of regulation in cellular systems Science (2008) Nature (2004) Mol Sys Bio (2009) Genome Level Genomes & regulation Regulation and genome evolution Transcriptional regulation and genome organization PNAS (2008) Nature Genetics (2004) Genome research (2009) Overview: How is regulation achieved in cellular systems? Scale of complexity
Outline Structure of the transcriptional regulatory network Evolution of the transcriptional regulatory network Dynamic nature of the transcriptional regulatory network Hierarchy and node-dynamics of regulatory networks
Detailed Outline Structure of the transcriptional regulatory network Local network structure: network motifs Global network structure: scale-free structure Evolution of the transcriptional regulatory network Dynamic nature of the transcriptional regulatory network Hierarchy and node-dynamics of regulatory networks
Basic unit Transcriptional interaction Global structure - Scale free network All interactions in a cell Local structure - Motifs Patterns of interconnections Transcription factor Target gene Basic unit Peptide link between amino acids Global structure Class/Fold Local structure Secondary structure Organization of the transcriptional regulatory network analogy to the organization of the protein structures
Local level: Transcriptional networks are made up of motifs which perform information processing task Global level: Transcriptional networks are scale-free conferring robustness to the system Properties of transcriptional networks
Single input Motif Multiple input Motif Feed Forward Motif ArgR TrpR TyrR Crp AroL AroM AraBAD ArgD AraC ArgE ArgF - Co-ordinates expression - Enforces order in expression - Quicker response - Integrates different signals - Quicker response Function - Responds to persistent signal - Filters noise Transcriptional networks are made up of motifs Network Motif “Patterns of interconnections that recur at different parts and with specific information processing task”
1 N (k) a g k Transcriptional networks are scale-free Scale-free structure Presence of few nodes with many links and many nodes with few links Scale free structure provides robustness to the system
Tolerant to random removal of nodes (mutations) Vulnerable to targeted attack of hubs (mutations) – Drug targets Hubs are crucial components in such networks Scale-free networks exhibit robustness Robustness – The ability of complex systems to maintain their function even when the structure of the system changes significantly
Summary I – Structure of transcriptional networks Transcriptional networks are made up of motifs that have specific information processing task Transcriptional networks have a scale-free structure which confers robustnessto such systems, with hubs assuming importance Madan Babu M, Luscombe N et. al Current Opinion in Structural Biology
Detailed Outline Structure of the transcriptional regulatory network Local network structure: network motifs Global network structure: scale-free structure Evolution of the transcriptional regulatory network Evolution of local network structure Evolution of global network structure Dynamic nature of the transcriptional regulatory network Hierarchy and node-dynamics of regulatory networks
Organismal evolution Growth of the regulatory network Evolution of the transcriptional regulatory network in yeast How did the regulatory network evolve?
A Duplication Divergence A’ A’’ Duplication & Divergence Mechanisms for the creation of new genes OR Recombination/Innovation
Gene duplication and network growth Loss & gain Inheritance Inheritance Loss & gain Duplication Duplication of TF of TG Duplication of TF+TG Gain Gain Loss & inheritance Inheritance, loss and gain of interaction
Evolution of the transcriptional regulatory network Entire network Duplication & inheritance 101 innovation (12%) 166 duplication of TG (20%) 31 duplication of TG + TF (4%) 365 duplication & gain (43%) 385 duplication & inheritance (45%) 188 duplication of TF (22%) ~90% of the network has evolved by duplication followed by Inheritance, loss and gain of interaction
How can such events affect local and global network structure? Are the motifs and scale free structure products of duplication events ? Are the motifs and scale free structure selected for in evolution ?
Duplication models and evolution of network motifs Duplication of TF & TG Duplication of TF Duplication of TG Growth models Motifs Single Input Module Feed-Forward Motif Multiple input motif
Network motifs have evolved independently (convergent evolution) multiple times because they confer specific properties to the network Evolution of local network structure Very rarely we find instances where duplication events have resulted in the formation of network motifs
“Rich gets richer” Duplication & inheritance Duplication & inheritance (2) (2) (2) (4) (6) (5) Total = 6 Total = 7 Total = 8 Duplication and evolution of scale free structure Growth by gene duplication and inheritance of interaction can explain evolution of scale-free structure Regulatory hubs should control more duplicate genes
Scale free structure has been selected for in evolution and is not a product of duplication events Evolution of global network structure Regulatory hubs do not regulate duplicate genes more often than any other normal transcription factor
101 innovation (12%) 365 duplication & gain (43%) 385 duplication & inheritance (45%) Summary II - Evolution Gene duplication followed by inheritance of interaction and gain of new interactions have contributed to 90% of the network Network motifs and the scale free structure are not products of duplication events, but have been selected for in evolution Teichmann SA & Madan Babu M Nature Genetics
Detailed Outline Structure of the transcriptional regulatory network Local network structure: network motifs Global network structure: scale-free structure Evolution of the transcriptional regulatory network Evolution of local network structure Evolution of global network structure Dynamic nature of the transcriptional regulatory network Dynamics of local network structure Dynamics of global network structure Hierarchy and node-dynamics of regulatory networks
Temporal dynamics of the regulatory networks Static regulatory network in yeast Cell cycle Sporulation ~ 7000 interactions involving 3000 genes and 142 TFs Across all cellular conditions Stress How does the local structure change in different cellular conditions? How does the global structure change in different conditions?
Transcription Factors Gene expression data for 5 cellular conditions Cell-cycle Sporulation DNA damage Diauxic shift Stress Target Genes 142 TFs 1,808 TGs 4,066 Interactions 1 condition 4 conditions 2 conditions 5 conditions 3 conditions Integrating gene regulatory network with expression data 142 TFs 3,820 TGs 7,074 Interactions
Active sub-network Gene regulatory network Identify differentially regulated genes Find TFs that regulate the genes Find TFs that regulate these TFs Back-tracking method to find active sub-networks
Regulatory program specific transcriptional networks Stress Binary Processes Regulatory programs involved in survival Diauxic shift DNA damage Cell cycle Multi-step Processes Regulatory programs involved in development Sporulation Sporulation Pre-sporulation Germination G0 G1 S G2 M E L M
Temporal dynamics of local structure Multi-step regulatory programs (development) Binary regulatory programs (survival) fast acting & direct fast acting & direct slow acting & indirect Network motifs that allow for efficient execution of regulatory steps are preferentially used in different regulatory programs
Hubs regulate other hubs to trigger cellular events Condition specific hubs Each regulatory program is triggered by specific hubs Permanent hubs Active across all regulatory programs This suggests a dynamic structure which transfers ‘power’ between hubs to trigger distinct regulatory programs (developmental & survival) Temporal dynamics of global structure (hubs)
Connectivity Path length Clustering coefficient Network Parameters
multi-stage conditions binary conditions Diauxic shift DNA damage Stress Cell cycle Sporulation • more target genes per TF • shorter path lengths • less inter-regulation • between TFs • fewer target genes per TF • longer path lengths • more inter-regulation • between TFs Quick response Fidelity in response Sub-networks re-wire both their local and global structure to respond to cellular conditions efficiently Luscombe N, Madan Babu M et. al Nature (2004)
Summary III - Dynamics Network motifs are preferentially used under the different cellular conditions and different proteins act as regulatory hubs in different cellular conditions Sub-networks have evolved both their local structure and global structure to respond to cellular conditions efficiently Luscombe N, Madan Babu M et. al Nature (2004)
Detailed Outline Structure of the transcriptional regulatory network Local network structure: network motifs Global network structure: scale-free structure Evolution of the transcriptional regulatory network Evolution of local network structure Evolution of global network structure Dynamic nature of the transcriptional regulatory network Dynamics of local network structure Dynamics of global network structure Hierarchy and node-dynamics of regulatory networks Hierarchy in transcriptional networks Noise in gene expression – implications for transcriptional networks
Dynamics in transcription and translation Each node in the network represents several entities (gene, mRNA, and protein) and events (transcription, translation, degradation, etc) that are compressed in both space and time
1 10 10 4 4 4 1 1 9 9 3 5 5 5 2 3 3 6 6 6 2 2 7 7 8 8 10 9 7 8 Higher-order organization of transcriptional regulatory networks Inherent higher-order organization Flat structure Hierarchical structure
predator prey Applicable on cyclic networks Consistent ordering Scalable Allows for ambiguity (e.g. Mouse) Methods to infer hierarchical organization in networks Topological sort Food web network Leaf-removal algorithm BFS-level algorithm ? 6 5 4 4 4 3 2-4 3 3 2 2 2 1 1 1
Top layer Transcription Factor Topological Sort Core layer Bottom layer Target gene Target Genes ARG80 ARO80 AZF1 Level 7 CHA4 MBP1* SKN7* OAF1 MAC1 Top (25) DAL82 FLO8* MET31 HAL9 Level 6 NRG1* ABF1*◄ MAL33 MCM1◄ ZAP1 MET32 PIP2 ACE2 ADR1 AFT1* AFT2* ARG81 ASH1 CBF1* CIN5* CUP9 DAL80 DAL81 FHL1*◄ FKH1 FKH2* GAL4 GAT1 RDR1 ARR1 GAT3 GCN4* GLN3 GTS1 GZF3 HAP1 HAP4 HCM1* RLM1 PDC2◄ DAT1 Level 5 HMLALPHA2 HMS2 HSF1*◄ INO2 INO4 IXR1 LEU3 MGA1* Core (64) THI2 RTG1 MIG1 MIG2 MSN2* MSN4* NDT80 PHD1* PLM2* PUT3 UPC2 OTU1 RPH1 SMP1 SOK2* EDS1 RAP1*◄ REB1*◄ RIM101 ROX1 RPN4 SKO1 PHO2 YBL054W TOS8* TYE7 STE12* SUT1 SWI4* SWI5 TEC1* TOS4* YDR266C XBP1 YAP1 YAP5* YAP6* YAP7* YHP1 UME6* YOX1* YJL206C Level 4 RTG3 MET4◄ CAT8 HMS1 FZF1 ACA1 HAC1 YKR064W Level 3 HMRA1 HMRA2 PHO4 SPT23 STP1 PDR1 CUP2 CRZ1 CAD1 YRM1 RME1 SIP4 RGT1 SUM1 UGA3 ECM22 MAL13 CST6 LYS14 Bottom (59) Level 2 STP2 GCR1◄ YAP3 YDR026C MSS11 MSN1 MOT3 BAS1 PDR8 MET28 MIG3 PPR1 RDS1 RGM1 SFP1 PDR3 HMLALPHA1 IME2 Level 1 STB4 STB5 YRR1 WAR1 URC2 USV1 SFL1 YDR049W MATALPHA1 STP4 YER130C YER184C YML081W YPR196W SRD1 * Regulatory hubs ◄ Essential genes Hierarchical organization of the yeast regulatory network
Hierarchical organization of regulatory proteins Regulatory proteins are hierarchically organized into three basic layers Top layer (29) Core layer (57) Bottom layer (58) Target Genes Do TFs in the different hierarchical levels have distinct dynamic properties?
Transcript abundance (Holstege et al., 1998) Transcript half-life (Wang et al., 2002) (Yang et al., 2003) Protein abundance (Ghaemmaghami et al, 2003) Protein half-life (Belle et al, 2006 ) Transcript abundances for yeast grown in YPD (S. cerevisiae) and Edinburgh minimal medium (S. pombe) were determined by using an Affymetrix high density oligonucleotide array. Transcript half-lives were determined by obtaining transcript levels over several minutes after inhibiting transcription. This was done using the temperature sensitive RNA polymerase rpb1-1 mutant S. cerevisiae strain. Estimates of the endogenous protein expression levels during log-phase were obtained by TAP-tagging every yeast protein for S. cerevisiae. Protein half-lives were determined by first inhibiting protein synthesis via the addition of cyclohexamide and by monitoring the abundance of each TAP-tagged protein in the yeast genome as a function of time. Translational dynamics Transcriptional dynamics Datasets characterizing dynamics of transcription and translation
Regulation of transcript abundance or degradation does not appear to be a major control mechanism by which the steady state levels of TFs are controlled Regulation of protein abundance and degradation appears to be a major control mechanism by which the steady state levels of TFs are controlled Regulation of regulatory proteins within the hierarchical framework post-transcriptional regulation plays an important role in ensuring the availability of right amounts of each TF within the cell
Almost no noise Frequency Frequency Frequency Noisy Very Noisy No of copies No of copies No of copies Noise in protein levels in a population of cells Noise in a population of cells can be beneficialwherephenotypic diversity could be advantageous but detrimentalif homogeneity and fidelity in cellular behaviour is required 5 6 12 1 4 3 No. of copies of Protein i 3 8 1 3 9 1 19 2 7 10 0 8 Population of cells Lopez-Maury L, Marguaret S and Bahler J, Nat Rev Genet 2008
Noise levels of regulatory proteins Top layer Core layer Bottom layer Target Genes Less noisy More noisy Regulatory proteins in the top layer are more noisy than the ones in the core or bottom layer
Individual 4 Individual 3 Individual 1 Individual 2 Differential utilization of the same underlying network by different individuals in a population of cells Noise in TF expression may permit differential utilization of the same underlying regulatory network in different individuals of a population Implication Underlying network
Clonal cell population experiencing stimulus 1 Underlying transcription regulatory network Stimulus 1 response pathway Stimulus 2 response pathway Variability in expression of top-layer TFs permits differential sampling of the same underlying network by distinct members of a genetically identical population of cells Non-genetic variation due to differential transcription network utilization
Change in stimulus = Stimulus 1 Stimulus 2 Stimulus 1 Non-genetic variation due to differential transcription network utilization Non-genetic variability and dynamics in expression of key TFs might confer selective advantage as this permits at least some members in a clonal population to respond efficiently to (or survive in) changing conditions
High variability in the expression of top-level TFs in a population of cells may confer a selective advantage as this permits at least some members in a population to respond quickly to changing conditions Gene network controlling sporulation Nachman et al Cell (2008) Phenotypic variability in fluctuating environments Noise in expression of a master regulator of sporulation in yeast
Spencer et al Nature (2009) Bastiaens P Nature (2009) Differences in the levels of proteins regulating apoptosis are the primary causes of cell-to-cell variability in the timing and probability of death in individual members upon induction Network controlling apoptosis Noise in expression of a key regulator of apoptosis in human cancer cells Dynamics of the regulatory proteins, which either dictate cell death or survival, varied widely between individual cancer cells upon addition of a drug Cohen et al Science (2008) Differential cell-fate outcome in response to uniform stimulus
Summary IV – local dynamics of regulatory networks Our results suggest that the core- and bottom-level TFs are more tightly regulated at the post-transcriptional level rather than at the transcriptional level itself Our findings suggest that the interplay between the inherent hierarchy of the network and the dynamics of the TFs permits differential utilization of the same underlying network in distinct members of a population Jothi R, Balaji S et al., Mol Sys Biol (2009)
Conclusions “Transcriptional networks are made up of network motifs at the local level and have a scale-free structure at the global level” “Even though close to 90% of the regulatory network in yeast has evolved by duplication, network motifs and scale free structure are not products of duplication events – instead they have been selected for in evolution” “This has resulted in a network structure that can efficiently re-wire interactions to meet the biological demand placed by the process” “The interplay between the hierarchy and node dynamics makes the network both robust and adaptable to changing conditions” “All these aspects of the regulatory network has constrained the way genes are organized across the different linear chromosomes in yeast”
Acknowledgements Raja Jothi S Balaji NCBI, NIH, USA Sarah Teichmann MRC-LMB, UK L Aravind NCBI, NIH, USA Nick Luscombe EBI, Hinxton, UK Sarath Janga MRC-LMB, UK Mark Gerstein Haiyuan Yu Mike Snyder Yale University, USA Arthur Wuster Joerg Gsponer MRC-LMB, UK Joshua Grochow U. Chicago, USA Teresa Przytycka NCBI, NIH, USA Julio Collado-vides UNAM, Mexico MRC - Laboratory of Molecular Biology, UK National Institutes of Health, USA Schlumberger and Darwin College, Cambridge, UK