Analysis of Sequence Artifacts in FFPE Samples from Anatomical Pathology Labs
This study compares sequence artifact changes in FFPE samples between different anatomical pathology laboratories. It includes data on allele frequency range alterations and copies of the FTH1 gene. Supplementary figures show the results from samples and negative validation of a specific mutation.

Analysis of Sequence Artifacts in FFPE Samples from Anatomical Pathology Labs
E N D
Presentation Transcript
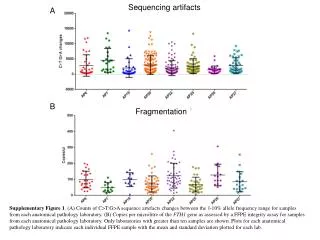
Sequencing artifacts A B Fragmentation Supplementary Figure 1. (A) Counts of C>T:G>A sequence artefacts changes between the 1-10% allele frequency range for samples from each anatomical pathology laboratory. (B) Copies per microlitre of the FTH1 gene as assessed by a FFPE integrity assay for samples from each anatomical pathology laboratory. Only laboratories with greater than ten samples are shown. Plots for each anatomical pathology laboratory indicate each individual FFPE sample with the mean and standard deviation plotted for each lab.
c.35 G>A, p.G12D not detected NRAS exon 2 for Ca97 Supplementary Figure 2. Negative validation of a c.35 G>A, p.G12D NRAS exon 2 mutation for a melanoma case (Ca97) as assessed by MPS using a Fluidigm Access Array: Alignment of NRAS exon 2 using the Integrative Genomics Viewer. Arrow indicates position c.35 of the NRAS gene.