Download
1 / 24
240 likes | 394 Vues
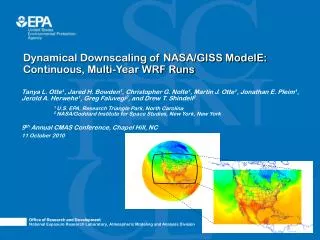
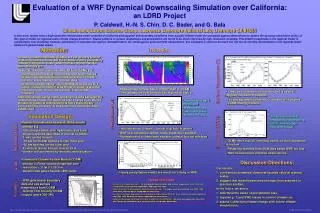
Evaluation of a CCSM-WRF Downscaling Simulation for California. Peter Caldwell, Hung-Neng S. Chin, and David C. Bader. Lawrence Livermore National Lab. Why downscaling? Why dynamical? . Topography (m) and Mar 1st Snow Water Equivalent (mm). GCMs don’t resolve important mesoscale features

E N D
Evaluation of a CCSM-WRF Downscaling Simulation for California Peter Caldwell, Hung-Neng S. Chin, and David C. Bader Lawrence Livermore National Lab UCRL: LLNL-PRES-405987
Why downscaling? Why dynamical? Topography (m) and Mar 1st Snow Water Equivalent (mm) • GCMs don’t resolve important mesoscale features • Changes at these scales have the strongest impact on humans • Regional information comes from: • Statistical downscaling: using observed relationships between variables at different spatial scales to predict regional changes from coarser data • Will observed relationships hold in a changed climate? • Dynamical downscaling: driving a weather-forecasting model with data from a coarser climate model • Dynamical downscaling can validate statistical methods • But are these models accurate? 1500 1000 500 CCSM 2000 1500 3000 500 500 OBS UCRL: LLNL-PRES-405987
Fig. 1: Outer-domain topography and model boundaries 3000 2000 1000 0 Elevation (m) inner domain outer domain Simulation Design • Weather Research and Forecasting Model setup: • version 2.2, ARW core • 2-way coupling between 12 km and 36 km nests • 31 vertical levels (bottom at 15 m) • Parameterizations: • Kain-Fritsch convection • Thompson microphysics • RRTM/Dudhia radiation • YSU boundary layer scheme • RUC surface scheme • Community Climate System Model: • version 3, finite-volume core • 1ºx1.25º resolution (~T85) • 1990 greenhouse gas levels • (Bala et al, 2008 J. Clim) • Run: • 40 year simulation with monthly reinitialization to prevent climate drift UCRL: LLNL-PRES-405987
Precipitation • WRF much better than CCSM at capturing regional detail • WRF and CCSM precip averaged over the WRF domain are similar UW precip dataset: • includes PRISM topographic fixes • 1915-2003 DJF climatology WRF overpredicts precip in wet areas • a typical bias (e.g. Duffy et al, 2006 J. Climate) WRF Obs (University of WA) CCSM DJF Average Precip (mm day-1) 0.8 2.4 4 5.6 7.2 8.8 10.4 12 UCRL: LLNL-PRES-405987
Distribution of Precip Intensity DJF Bias in Precip Exceedence Probability • WRF precip too strong, too infrequent • A common bias? • WRF bias in mountains due to resolved-scale precip 4 9 Coast Region Mountain Region 7 3 Model Overpredicts 5 2 WRF – UW total precip 3 1 1 0 Error (%) -1 -1 -3 Model Underpredicts -2 -5 WRF – UW resolved precip -3 -7 -4 -9 0 12 24 36 48 60 0 12 24 36 48 60 72 Threshold (mm day-1) Threshold (mm day-1) UCRL: LLNL-PRES-405987
WRF–NARR DJF Zonal Moisture Flux Difference 54 48 42 36 30 24 18 -138 -132 -126 -120 -114 -108 -102 Vertically-Integrated Flux (kg m-2 m s-1) -55 -35 -15 0 15 35 55 Excessive Moisture from Ocean? • “Synthetic Observations”: • NARR = N American Regional Reanalysis • 32 km grid spacing • Assimilates precip, precipitable water… • Bias largely inherited from western boundary (CCSM) • too wet N, too dry S • Bias around CA small • precip bias not due to moisture flux? • bias-correcting the SST does not improve precip statistics UCRL: LLNL-PRES-405987
Not a Land Surface Problem Tested importance of land surface by performing 10 yrs of December simulations with latent heat flux (LHF) turned off over land. 40-yr Ctrl Simulation – Obs (Dec) 10-yr Run w/ Land-LHF off – Ctrl (Dec) • Land surface has little effect on W. Coast winter precip • Unsurprising since <5% W Coast winter precip from local moisture (Trenberth 1999, J. Climate) • Suggests spin-up not important for winter precip (mm day-1) (mm day-1) UCRL: LLNL-PRES-405987
What else could causethis bias? • Cumulus/microphysics scheme interaction? • Moisture profiles, clouds? • Other ideas? UCRL: LLNL-PRES-405987
Snowpack • WRF snowpack forced to (insufficient) GCM value at 1st of each month! • WRF accumulation (resets omitted) matches obs Potential Fixes: • Run continuously with/without nudging outer domain towards large-scale forcing • Reinitialize using previous month’s surface info UCRL: LLNL-PRES-405987
Temperature Average over Coastal Region WRF CCSM3 UW (Obs) PRISM (Obs) • Good wintertime agreement with obs • Several degrees too warm in summer • Strong agreement between CCSM and WRF suggests GCM induced Average over Mountain Region UCRL: LLNL-PRES-405987
Conclusions/Future Work • WRF produces significantly better spatial precip distribution than CCSM • Wintertime precip too strong, but too infrequent. • Not due to land surface or coastal moisture fluxes • WRF snowpack poor due to monthly resets • Accumulation matches observations • Wintertime surface temperature reasonable, summertime too warm • Summertime problem inherited from CCSM (hard to fix) UCRL: LLNL-PRES-405987
END Contact: caldwell19@llnl.gov UCRL: LLNL-PRES-405987
Snow-Albedo Feedback Small Dec 0300 2m T: Continuous vs Reinit 2m T Difference (K) UCRL: LLNL-PRES-405987
40-yr Ctrl Simulation – Obs (Dec) 10-yr Run w/ Land-LHF off – Ctrl (Dec) 0 Note scale difference! (mm day-1) (mm day-1) Not a Land Surface Problem Tested importance of land surface by performing 10 yrs of December simulations with latent heat flux (LHF) turned off over land. • Land surface has little effect on W. Coast winter precip • Unsurprising since <5% W Coast winter precip from local moisture (Trenberth 1999, J. Climate) • Suggests spin-up not important for winter precip UCRL: LLNL-PRES-405987
Positive-Definite Moisture Advection • Precip becomes more important at higher resolution: 12 km is still too coarse to see much effect. Dec p Bias (WRF-UW obs) Precip Diff (PD – non-PD) (mm day-1) (mm day-1) UCRL: LLNL-PRES-405987
Dec p Bias (WRF-UW obs) Dec p Diff (Grell – Kain-Frisch) Effect of Cumulus Scheme • Grell less precip along coast • Doesn’t make much difference over mtns. • Grell has issue at border of inner domain. • Interesting that convective component of pcp not large, but convective impact big. (mm day-1) (mm day-1) UCRL: LLNL-PRES-405987
Dec p Bias (WRF-UW obs) Precip Diff (12 wide – 5 wide) Increasing Nudging Zone • Difference not tied to topography – random noise?. • WRF expects outflow but forcing model expects inflow → convergence (mm day-1) (mm day-1) UCRL: LLNL-PRES-405987
WRF V3 vs WRF V2.2.1 • V3 has more coastal precip, not much diff in mtns. • Due to micro-physics param? • 2m T>>warmer in V3 (V2 had cold bias?) UCRL: LLNL-PRES-405987
Better coastline interp Positive definite advection Deep soil param/CLM? Rethink parameterizations Continuous simulation Interior nudging? Use V3 to remove cold bias Model spin-up Intelligent placement of outer domain boundaries Which GCM to force with? Think about desired output Cloud variables! 3 or 6 hrly output interval Store results in 1 mo blocks for easy archive access (use htar!). Postprocess so all times for given variable are stored contiguously For new simulation: UCRL: LLNL-PRES-405987
WRF CCSM3 UW (Obs) NOAA (Obs) Seasonal Cycle of Precipitation • Both models reproduce the observed seasonal cycle • Wintertime precip over-predicted • WRF variability over-predicted (proportional to increased magnitude) • CCSM looks better (because it smears precip over wider area) 1-σ bounds from monthly data UCRL: LLNL-PRES-405987
WRF – NARR DJF-average LHF LHF (W m-2) 0 10 20 30 40 50 60 DJF Latent Heat Flux Bias • WRF>NARR almost everywhere • Is NARR moisture budget consistent? UCRL: LLNL-PRES-405987
Bias due to SST Errors? • December precipitation uncorrelated to domain-average SST in our model! • Sensitivity study with bias-corrected SST made little difference. UCRL: LLNL-PRES-405987
Snowpack Mountain-Region Average • WRF snowpack forced to (insufficient) GCM value at 1st of each month! • WRF accumulation (resets omitted) matches obs WRF ctrl (accumulated) WRF 1yr continuous NOHRSC (obs) SWE (mm) WRF ctrl CCSM Potential Fixes: • Run continuously with/without nudging outer domain towards large-scale forcing • Reinitialize using previous month’s surface info UCRL: LLNL-PRES-405987
DJF Bias in Precip Exceedence Probability 9 4 Coast Region Mountain Region 7 3 Model Overpredicts 5 2 WRF – UW total precip 3 1 1 0 Error (%) -1 -1 CCSM – UW total precip -3 Model Underpredicts -2 -5 -3 WRF – UW resolved precip -7 -4 -9 0 12 24 36 48 60 72 0 12 24 36 48 60 Threshold (mm day-1) Threshold (mm day-1) Distribution of Precip Intensity • WRF precip too strong, too infrequent • A common bias? • WRF bias in mountains due to resolved-scale precip UCRL: LLNL-PRES-405987