Download
1 / 22
220 likes | 361 Vues
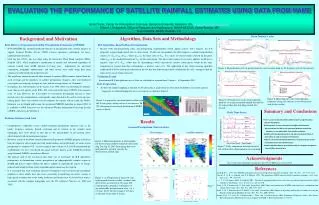
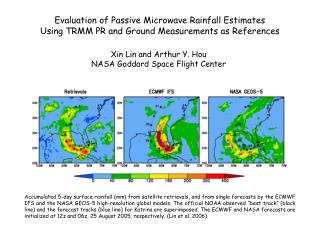
Evaluating the drought monitoring capabilities of rainfall estimates for Africa. Chris Funk Pete Peterson Amy McNally. What makes good rainfall estimates go bad?. Sparse station data Inconsistent networks Complex mean fields Biased satellite estimates Inhomogeneous satellite inpu ts.

E N D
Evaluating the drought monitoring capabilities of rainfall estimates for Africa Chris Funk Pete Peterson Amy McNally
What makes good rainfall estimates go bad? • Sparse station data • Inconsistent networks • Complex mean fields • Biased satellite estimates • Inhomogeneous satellite inputs
Climate Hazard Group Climatology Method Spatial Means Dense gauge observations Elevation, latitude, longitude Satellite mean fields Sparse gauge observations Satellite anomaly fields TemporalAnomalies
FEWS NET TRMM-IR Precipitation (FTIP) • Quasi-global (±60°N/S), 0.05°, pentads • Built around 0.05° rainfall mean fields • FEWS NET Climatology (FCLIM) • Two components • TRMM V6/RT as percentage (TR%) • Cold cloud duration IR estimates as percentages (IR%) • Global CCD models trained against TRMM 3B42 pentads • CCD threshold, slope, intercept for each month • FTIP = (0.5 TR% + 0.5 IR%) * FCLIM • Unbiased IR precipitation (UIRP) = IR% * FCLIM
Hispaniola Rainfall dekads: TRMM and FTIP Satellite % X FCLIM --------------- Improved Rainfall Estimates TRMM FTIP
Building better climatologies • Use regional moving window regressions to model long term mean monthly rainfall as a function of • Elevation, Slope, latitude, longitude, … • TRMM, Land Surface Temperatures, Infrared brightness temperatures, …. • Use standard interpolation approaches (kriging or IDW to blend in station anomalies)
Local correlations w/ satellite mean fields much better than elevation or slope
Drought monitoring validation study for Africa • Modeled after previous analyses by Grimes and Dinku • 0.25° block kriged monthly station data (2001-2010) • Interpolated as %, multiplied by FCLIM • Study looks at drought hits, misses, false alarms and correct negatives • Drought event defined as a two-month period with less than 190 mm of rainfall • Focused on main rainy season rainfall • For each grid cell, • Identify three month period with max average rainfall • Build time-series of two-month rainfall combinations
Building time-series of main season rainfall • Identify main rainy season (i.e. MAM) • For each year, construct three 2-month combinations: e.g. March+April, April+May, March+May • Do this for each year to obtain ~27 combinations: 2001MA, 2001AM, 2001MM, 2002MA, 2002AM, 2002MM, 2003MA, 2003AM, 2003MM, 2004MA, 2004AM, 2004MM, 2005MA, 2005AM, 2005MM, 2006MA, 2006AM, 2006MM, 2007MA, 2007AM, 2007MM, 2008MA, 2008AM, 2008MM, 2009MA, 2009AM, 2009MM, 2010MA, 2010AM, 2010MM • Focus on rainfall during germination/grain filling
Hits and misses 190 mm Correct Negative False Alarm 190 mm Kriged Station Data Miss Hit Satellite Estimate
Conclusions • Incorporating climatologies improves skill • FCLIM unbiasing easily reproducable with TARCAT, ECMWF, … • Fitting CCD models using TRMM 3B42 seems worthwhile • RFE2, FTIP, and TARCAT showed best-correlations • FTIP and then the TRMM showed the smallest mean bias • TARCAT, RFE2 and FTIP had lower MAE • TARCAT, RFE2, FTIP, ECMWF do a good job discriminating hits and correct negatives • Misses • Some in the Sahel (RFE2, TRMM, RFE2) • Sudan (ECMWF) • False Alarms: • Part of east Africa in each • Sahel in ECMWF • Focus on rainfall during germination/grain filling