RSV Testing Trends in Georgia: 2013-2014 Season Analysis
Dive into the average RSV percent positives and insights from the RSVAlert program to understand the fluctuating RSV testing patterns in Georgia during the 2013-2014 season. Explore weekly variations due to late provider reporting for a comprehensive view.

RSV Testing Trends in Georgia: 2013-2014 Season Analysis
E N D
Presentation Transcript
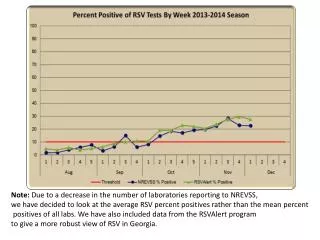
Note: Due to a decrease in the number of laboratories reporting to NREVSS, we have decided to look at the average RSV percent positives rather than the mean percent positives of all labs. We have also included data from the RSVAlertprogram to give a more robust view of RSV in Georgia.
Percent Positive of RSV Tests by Week 2013-2014 Season* *Data may vary week to week due to late provider reporting
Percent Positive of RSV Tests by Week 2013-2014 Season (Cont.)* *Data may vary week to week due to late provider reporting