Statistical Power of Meta-analysis in Detecting Diabetes Variants
10 likes | 113 Vues
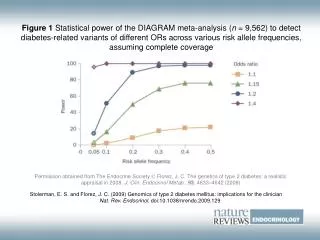
Explore the statistical power of DIAGRAM meta-analysis with 9,562 samples to identify diabetes-related variants of varying odds ratios across different risk allele frequencies. Obtain permission from The Endocrine Society. References by Florez, J.C. and Stolerman, E.S. Detailed in-depth analysis of type 2 diabetes genetics.

Statistical Power of Meta-analysis in Detecting Diabetes Variants
E N D
Presentation Transcript
Figure 1 Statistical power of the DIAGRAM meta-analysis (n = 9,562) to detect diabetes-related variants of different ORs across various risk allele frequencies, assuming complete coverage Permission obtained from The Endocrine Society Florez, J. C. The genetics of type 2 diabetes: a realistic appraisal in2008. J. Clin. Endocrinol Metab.. 93, 4633–4642 (2008) Stolerman, E. S. and Florez, J. C. (2009) Genomics of type 2 diabetes mellitus: implications for the clinician Nat. Rev. Endocrinol. doi:10.1038/nrendo.2009.129