Download
1 / 16
160 likes | 280 Vues
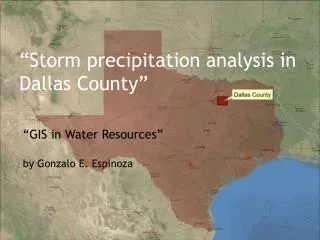
This study examines storm precipitation data in Dallas County from 1997 to 2009, utilizing high-resolution Doppler radar and NEXRAD data. We analyzed data from 147 virtual stations, processing daily and hourly precipitation records for improved hydrologic system design and drainage management. The results reveal significant insights into precipitation distribution patterns, with an average annual precipitation of 33.76 inches observed. The analysis highlights the importance of GIS in managing water resources, offering valuable computational tools for hydrologic modeling and data processing.

E N D
“Storm precipitation analysis in Dallas County” “GIS in WaterResources” by Gonzalo E. Espinoza
Introduction • Design Hydrologic systems • Drainage • Hydraulic Structures • Nextrad (NOAA) • High Resolution Doppler weather radars. • Source of Daily and Hourly data. • GIS • Data Acquisition • Data Processing • Results
Data Acquisition • 13 years • 1997 - 2009 • 147 Virtual Stations • Daily Data (147) • 697,500 • Hourly Data (5) • 569,00
Precipitation: Raw Data • Daily Hourly
Data Processing • Export table HydroDesktop • Add Table ArcGIS • Project x,y • Time Enabled bar • Thiessen Polygons Tool • Mean Center • Maximum Series • Daily • Hourly • ProbabilityDistribution • i-d-T and p-d-T curves
https://webspace.utexas.edu/gee272/www/Index_files/GIS/pMovie.wmvhttps://webspace.utexas.edu/gee272/www/Index_files/GIS/pMovie.wmv
Precipitation Distribution Daily Data Hourly Data • 147 Stations • AAP = 33.76 inches • Uniform • 5 Stations • AAP = 34.20 • South East
Results • 98.7% AAP • Same Mean / Different distribution • Representative values of precipitation • In order to compare, select the same stations
Conclusions • Derived Data • Representative • Smaller Extrapolated Area • Computational Time • Downloading, Processing and Projecting • IT fast development • HydroDesktop • Powerful Tool • Sometime Crashes (Beta Version)
Questions? https://webspace.utexas.edu/gee272/www/Index_files/Page305.htm Contact Information: ic.esda@mail.utexas.edu