Download
1 / 20
210 likes | 251 Vues
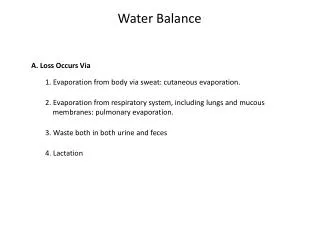
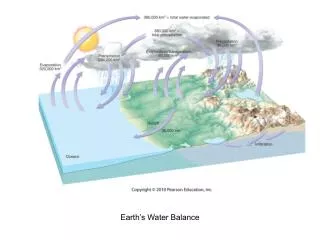
Explore water balance components, such as rainfall gauges, evaporation pans, stream gauging, and well hydrographs, to understand hydrological processes in watersheds.

E N D
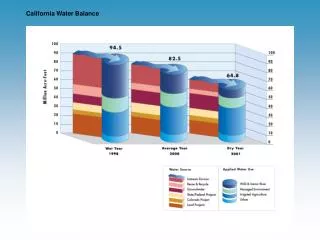
DBHydro • State Plane Coordinates • High Accuracy Reference Network (HARN) • Refinement of NAD83
DBHydroRainfall Stations • Approximately 600 stations
Spatial Distribution of Average Rainfall http://sflwww.er.usgs.gov/sfrsf/rooms/hydrology/compete/obspatialmapx.jpg
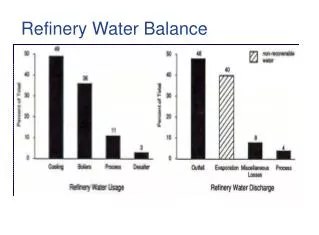
Evaporation Pan www.photolib.noaa.gov/ historic/nws/wea01170.htm
Pan Evaporation • Pan Coefficients: 0.58 – 0.78 (get hotter than lake) • Transpiration • Potential Evapotranspiration (water may not be in soil) • Thornwaite Equation
Watersheds http://www.bsatroop257.org/Documents/Summer%20Camp/Topographic%20map%20of%20Bartle.jpg
Watersheds http://www.bsatroop257.org/Documents/Summer%20Camp/Topographic%20map%20of%20Bartle.jpg
Stage Recorder http://gallatin.humboldt.edu/~brad/nws/assets/drum-recorder.jpg
Stream Gauging • Measure velocity at 2/10 and 8/10 depth • Q = v*A • Rating curve: • Q vs. Stage http://www.co.jefferson.wa.us/naturalresources/Images/StreamGauging.jpg
River Hydrograph http://cires.colorado.edu/lewis/epob4030/Figures/UseandProtectionofWaters/figures/ColoradoRiverHydrograph.gif
Recurrence Interval • T = n+1 /m • T: recurrence interval • n: number of data • m: rank (highest to lowest) • P = 1/T • http://serc.carleton.edu/quantskills/methods/quantlit/RInt.html
Well Hydrograph http://wy.water.usgs.gov/news/archives/090100b.htm
http://www.prescottcreeks.org/programs/watson%20woods/Inv%20and%20Mon/monitoring%20well.htmhttp://www.prescottcreeks.org/programs/watson%20woods/Inv%20and%20Mon/monitoring%20well.htm http://www.water.az.gov/dwr/Content/Find_by_Program/Hydrology/WQARF/content/Reports/Well_Images/MWwithNamePlate.JPG
Textbook Errata • http://members.cox.net/ground-water/errata.pdf