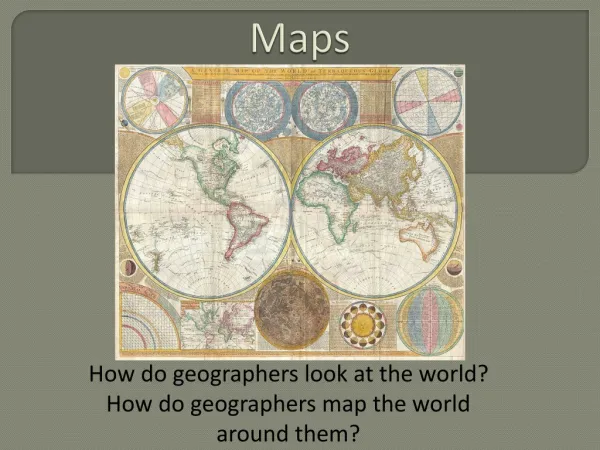
Cartography, Map Production and GeoVisualization
500 likes | 1.07k Vues
Cartography, Map Production and GeoVisualization. Geog 176B Lecture 10: Longley Chapters 12,13. Visual Variables: Bertin. Quantitative. Qualitative. Map Types: Point Data. Reference Topographic Dot Picture Symbol Graduated Symbol Multivariate symbol. Reference & Topo Map.

Cartography, Map Production and GeoVisualization
E N D
Presentation Transcript
Cartography, Map Production and GeoVisualization Geog 176B Lecture 10: Longley Chapters 12,13
Visual Variables: Bertin Quantitative Qualitative
Map Types: Point Data • Reference • Topographic • Dot • Picture Symbol • Graduated Symbol • Multivariate symbol
Picture Symbols/Icon Maphttp://tabi.joy.ne.jp/h-tokachigawa/icon/map.gif
Multivariate Symbol: Chernoff FacesSource: Eugene Turner, Dan Dorling
Map Types: Line Data • Network • Flow • Isopleth • Reference
Network Mapshttp://www.360.net http://www.luxembourg.co.uk/pics/railnetw.jpg
Flow Map: Europe Internet Trafficwww.cybergeography.org/atlas/census.html
Map Types: Area Data • Choropleth • Dasymetric • Area qualitative • Stepped surface • Hypsometric • Reference
2D Web Cartography • HTML embeds PNG, JPEG and GIF • Animation possible with GIF • Drawing extensions with SVG (XML) • Otherwise, need JAVA or FLASH • GIS data can be web enabled with on-line products such as Arc/IMS and GeoMedia Web Map, MapInfo Envinsa • Map open source tools
Map Types: Volume Data • [Isopleth, Stepped Surface, Hypsometric] • Gridded fishnet • Realistic perspective • Hill-shaded • Image map
Map Types: Time • Multiple views • Animation • Moving map • Fly thru • Fly by
3D Web Cartography • Unload interaction functions to web client • Build and make visible 3D models • VRML established as 3D web equivalent of HTML • GeoVRML is geographically enabled VRML • GML, X3D now available
(Geo)VRML • Public domain Web tools (CosmoCreate and Player) • Works for both immersive and passive displays • Symbolization at feature level, any dimension object • Integrated environment to develop, test and distribute cartographic methods • Combine traditional cartographic portrayal techniques, animation, and 3-dimensional display • Importance of nodes and georeferencing Worlds (GeoVRML 1.0) • Incorporates visual field depth via proximity sensor and zoom
EDA/Scientific Visualizationwww.ais.fraunhofer.de/NWEnglandAnalysis.gif