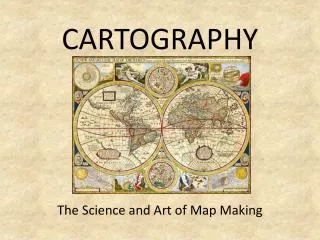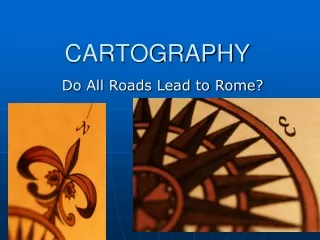
Cartography
Cartography. Creating Maps. Cartographers must: select the objects to be shown evaluate their relative importance find some way to simplify their form. Cartographers are limited by: the purpose of the map its scale the methods to produce it the accuracy of the data. Map Purpose.

Cartography
E N D
Presentation Transcript
Creating Maps Cartographers must: select the objects to be shown evaluate their relative importance find some way to simplify their form. Cartographers are limited by: the purpose of the map its scale the methods to produce it the accuracy of the data.
Map Purpose Aesthetics vs. conformality or equivalence Political considerations (size vs. importance) Website to discuss maps, mapmaking or related topics such as GIS, remote sensing and photogrammetry: http://www.cartotalk.com/
Scale Large Scale Small Scale
The size of a map’s smallest discernable unit is its Scale Density Region Resolution Projection d) Resolution - generally large-scale maps have a great resolution.
Mapping Methods Mapping cycling rides around Toronto 2004 to 2009 using GPS https://www.youtube.com/watch?v=iC56P-Ro4PY TTC Weekday Movement http://vimeo.com/1865789 Ork Posters http://www.orkposters.com/toronto.html
Aggregation Presidential elections by county and by state Gore Bush 2000 Election Results McCain Obama 2008 Election Results Information to be mapped is shown in a summary form e.g. USA elections
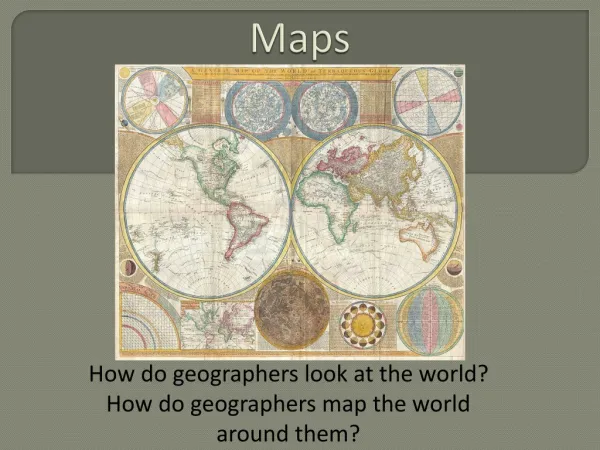
Types of Maps • Reference Maps CIA World Factbook: https://www.cia.gov/library/publications/the-world-factbook/docs/refmaps.html • ChoroplethMaps (shading, colouring or placement of symbols) • Isoline Maps (uses lines) • Proportional Symbol Maps • Dot Maps • Mental Maps
Choropleth Maps http://www.statcan.gc.ca/pub/92f0138m/2008003/figures/5200001-eng.htm
Isoline Maps http://mapmaker.rutgers.edu/355/Journey_to_Work.jpg
Isobar http://www.earthlyissues.com/images/isobar.gif Connect points of equal atmospheric pressure
Proportional Symbol Map http://personal.frostburg.edu/kebachtel0/square%20map.jpg
AP exam Free Response Question based on a Cartogram: Shown above is a special type of graphic used by geographers. 1. Identify the type of graphic by name. 2. What qualities does it have that qualify it as a graph? 3. What qualities would qualify it as a map?
Sources United Kingdom Department for communities and local government. http://www.neighbourhood.statistics.gov.uk/HTMLDocs/images/Statistical%20Maps%20-%20Best%20Practice%20v5_tcm97-51126.pdf