Two-Period Panel Data Analysis
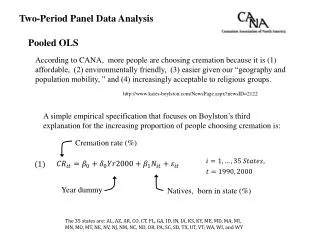
Two-Period Panel Data Analysis. Pooled OLS. According to CANA, more people are choosing cremation because it is (1) affordable, (2) environmentally friendly, (3) easier given our “geography and population mobility, ” and (4) increasingly acceptable to religious groups. .

Two-Period Panel Data Analysis
E N D
Presentation Transcript
Two-Period Panel Data Analysis Pooled OLS According to CANA, more people are choosing cremation because it is (1) affordable, (2) environmentally friendly, (3) easier given our “geography and population mobility, ” and (4) increasingly acceptable to religious groups. http://www.kates-boylston.com/NewsPage.aspx?newsID=2122 A simple empirical specification that focuses on Boylston’s third explanation for the increasing proportion of people choosing cremation is: Cremation rate (%) Year dummy Natives, born in state (%) The 35 states are: AL, AZ, AR, CO, CT, FL, GA, ID, IN, IA, KS, KY, ME, MD, MA, MI, MN, MO, MT, NE, NV, NJ, NM, NC, ND, OR, PA, SC, SD, TX, UT, VT, WA, WI, and WY
Cremation Rate (%) Native (% born in state)
Fewer people living in Colorado were born there than in Georgia and a lot of the variation in Native used to estimate is coming from between states and some of the variation is coming from within states over time. Colorado Cremation Rate (%) Georgia Native (% born in state)
Time varying error (idiosyncratic error) —unobserved factors that affect cremation rates and vary over time Fixed Effects Model State fixed effect () captures (time-invariant and unobserved) prices, regulations, environmental attitudes, religious attitudes. If they are observable, you are better off putting them into the equation as explanatory variables. Pooled OLS Pooled OLS is not substantially different from single-time-period OLS. If you have an omitted variable problem due to stuff in the error term, pooling the data doesn’t eliminate it.
For simplicity, suppose ⃝ + ⃝ – ⃝ – E downward bias
First Differences First-difference equation: eliminates
Estimating First-Differencing Models Demonstrates that models using fixed effects are using variation within states (or cities, counties, colleges, etc.) to estimate parameters Estimating Fixed Effects Models
Key Assumption is uncorrelated with This assumption holds if the idiosyncratic error (u) at each time period is uncorrelated with the explanatory variable in both time periods.
Costs and Benefits of Fixed Effects Model Benefit—controls for unobserved factors that vary across states, cities, colleges… Costs More expensive data collection Can reduce or eliminate variation in explanatory variables.