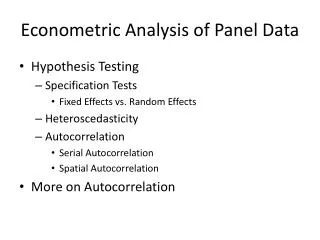
Panel Data Analysis Using GAUSS
Panel Data Analysis Using GAUSS. 1 Kuan-Pin Lin Portland State University. Panel Data Analysis Introduction. Panel Data Definition Unbalanced Panel Balanced Panel: Short Panel: Long Panel: Panel Data Analysis Unobserved Heterogeneity Cross Section and Time Series Correlation.


Panel Data Analysis Using GAUSS
E N D
Presentation Transcript
Panel Data AnalysisUsing GAUSS 1 Kuan-Pin LinPortland State University
Panel Data AnalysisIntroduction • Panel Data Definition • Unbalanced Panel • Balanced Panel: • Short Panel: • Long Panel: • Panel Data Analysis • Unobserved Heterogeneity • Cross Section and Time Series Correlation
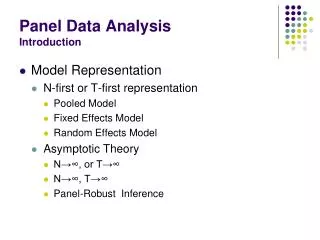
Panel Data AnalysisIntroduction • Model Representation • N-first or T-first representation • Pooled Model • Fixed Effects Model • Random Effects Model • Asymptotic Theory • N→∞, or T→∞ • N→∞, T→∞ • Panel-Robust Inference
Panel Data AnalysisIntroduction • The Model • One-Way (Individual) Effects: • Unobserved Heterogeneity • Cross Section and Time Series Correlation
N-first Representation Dummy Variables Representation T-first Representation Panel Data Analysis Introduction
Panel Data Analysis Introduction • Notations
Fixed Effects Model • ui is fixed, independent of eit, and may be correlated with xit.
Fixed Effects Model • Fixed Effects Model • Classical Assumptions • Strict Exogeneity: • Homoschedasticity: • No cross section and time series correlation: • Extensions: • Panel Robust Variance-Covariance Matrix
Random Effects Model • Error Components • ui is random, independent of eit and xit. • Define the error components as eit = ui + eit
Random Effects Model • Random Effects Model • Classical Assumptions • Strict Exogeneity • X includes a constant term, otherwise E(ui|X)=u. • Homoschedasticity • Constant Auto-covariance (within panels)
Random Effects Model • Random Effects Model • Classical Assumptions (Continued) • Cross Section Independence • Extensions: • Panel Robust Variance-Covariance Matrix
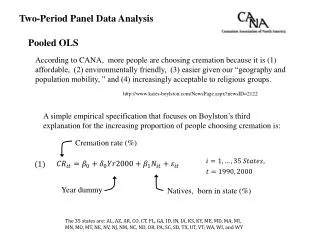
Example: Investment Demand • Grunfeld and Griliches [1960] • i = 10 firms: GM, CH, GE, WE, US, AF, DM, GY, UN, IBM; t = 20 years: 1935-1954 • Iit = Gross investment • Fit = Market value • Cit = Value of the stock of plant and equipment
Example: Output Function • Cobb-Douglas Output Function • i = 30 provinces; t = 11 years: 1996-2006 • ln(GDP)it = Log real GDP • ln(L)it = Log Labor Employment • ln(K)it = Log Capital Stock
References • B. H. Baltagi, Econometric Analysis of Panel Data, 4th ed., John Wiley, New York, 2008. • W. H. Greene, Econometric Analysis, 7th ed., Chapter 11: Models for Panel Data, Prentice Hall, 2011. • C. Hsiao, Analysis of Panel Data, 2nd ed., Cambridge University Press, 2003. • J. M. Wooldridge, Econometric Analysis of Cross Section and Panel Data, The MIT Press, 2002.