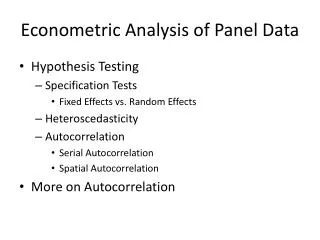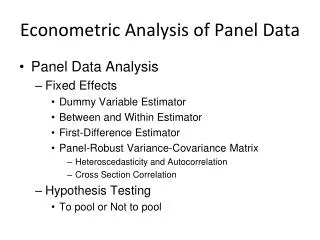
Panel Data Analysis Introduction
Panel Data Analysis Introduction. Model Representation N-first or T-first representation Pooled Model Fixed Effects Model Random Effects Model Asymptotic Theory N→∞, or T→∞ N→∞, T→∞ Panel-Robust Inference. Panel Data Analysis Introduction. The Model One-Way (Individual) Effects:

Panel Data Analysis Introduction
E N D
Presentation Transcript
Panel Data AnalysisIntroduction • Model Representation • N-first or T-first representation • Pooled Model • Fixed Effects Model • Random Effects Model • Asymptotic Theory • N→∞, or T→∞ • N→∞, T→∞ • Panel-Robust Inference
Panel Data AnalysisIntroduction • The Model • One-Way (Individual) Effects: • Unobserved Heterogeneity • Cross Section and Time Series Correlation
N-first Representation Dummy Variables Representation T-first Representation Panel Data Analysis Introduction
Panel Data Analysis Introduction • Notations
Example: Investment Demand • Grunfeld and Griliches [1960] • i = 10 firms: GM, CH, GE, WE, US, AF, DM, GY, UN, IBM; t = 20 years: 1935-1954 • Iit = Gross investment • Fit = Market value • Cit = Value of the stock of plant and equipment
Fixed Effects Model • ui is fixed, independent of eit, and may be correlated with xit.
Fixed Effects Model • Fixed Effects Model • Classical Assumptions • Strict Exogeneity: • Homoschedasticity: • No cross section and time series correlation: • Extensions: • Panel Robust Variance-Covariance Matrix
Random Effects Model • Error Components • ui is random, independent of eit and xit. • Define the error components as eit = ui + eit
Random Effects Model • Random Effects Model • Classical Assumptions • Strict Exogeneity • X includes a constant term, otherwise E(ui|X)=u. • Homoschedasticity • Constant Auto-covariance (within panels)
Random Effects Model • Random Effects Model • Classical Assumptions (Continued) • Cross Section Independence • Extensions: • Panel Robust Variance-Covariance Matrix
Fixed Effects Model Estimation Within Model Representation
Fixed Effects Model Estimation Model Assumptions
Fixed Effects Model Estimation: OLS • Within Estimator: OLS
Fixed Effects Model Estimation: ML • Normality Assumption
Fixed Effects Model Estimation: ML Log-Likelihood Function Since Q is singular and |Q|=0, we maximize
Fixed Effects Model Estimation: ML ML Estimator
Fixed Effects ModelHypothesis Testing • Pool or Not Pool • F-Test based on dummy variable model: constant or zero coefficients for D w.r.t F(N-1,NT-N-K) • F-test based on fixed effects (unrestricted) model vs. pooled (restricted) model
Random Effects Model Estimation: GLS The Model
Random Effects Model Estimation: GLS • Feasible GLS • Based on estimated residuals of fixed effects model
Random Effects Model Estimation: GLS • Feasible GLS • Within Model Representation
Random Effects Model Estimation: ML • Log-Likelihood Function
Random Effects Model Estimation: ML • ML Estimator
Random Effects ModelHypothesis Testing • Pool or Not Pool • Test for Var(ui) = 0, that is • For balanced panel data, the Lagrange-multiplier test statistic (Breusch-Pagan, 1980) is:
Random Effects ModelHypothesis Testing • Pool or Not Pool (Cont.)
Random Effects ModelHypothesis Testing • Fixed Effects vs. Random Effects
Random Effects ModelHypothesis Testing • Fixed effects estimator is consistent under H0 and H1; Random effects estimator is efficient under H0, but it is inconsistent under H1. • Hausman Test Statistic
Random Effects ModelHypothesis Testing • Alternative Hausman Test • Estimate the random effects model • F Test that g = 0
Extensions • Random Coefficients Model • Mixed Effects Model • Two-Way Effects • Nested Random Effects
Example: U. S. Productivity • Munnell [1988] Productivity Data48 Continental U.S. States, 17 Years:1970-1986 • STATE = State name, • ST ABB=State abbreviation, • YR =Year, 1970, . . . ,1986, • PCAP =Public capital, • HWY =Highway capital, • WATER =Water utility capital, • UTIL =Utility capital, • PC =Private capital, • GSP =Gross state product, • EMP =Employment,
References • B. H. Baltagi, Econometric Analysis of Panel Data, 4th ed., John Wiley, New York, 2008. • W. H. Greene, Econometric Analysis, 7th ed., Chapter 11: Models for Panel Data, Prentice Hall, 2011. • C. Hsiao, Analysis of Panel Data, 2nd ed., Cambridge University Press, 2003. • J. M. Wooldridge, Econometric Analysis of Cross Section and Panel Data, The MIT Press, 2002.