Download
1 / 20
200 likes | 347 Vues
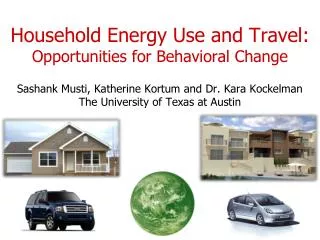
Household Energy Use and Travel: Opportunities for Behavioral Change. Sashank Musti, Katherine Kortum and Dr. Kara Kockelman The University of Texas at Austin. Questionnaire Design. Cover letter (English and Spanish) Five sections Travel Choices Vehicle Ownership

E N D
Household Energy Use and Travel:Opportunities for Behavioral Change Sashank Musti, Katherine Kortum and Dr. Kara Kockelman The University of Texas at Austin
Questionnaire Design • Cover letter (English and Spanish) • Five sections • Travel Choices • Vehicle Ownership • Home Design and Energy Use • Energy Policy Opinions • Demographics
Far West Manor Westlake Hyde Park East Austin Sunset Valley Survey Distribution
Survey Distribution(2) • Central Market Grocery • Flyers and URL cards • Community organizations • Web links via CapMetro and City sites • Internet version of the survey: www.energysurvey.co.nr
Data Weighting • Sample was compared to PUMS • Six control attributes: 720 categories • Gender (male, female) • Student status (student, non-student) • Worker status (worker, non-worker) • Age (18-24, 25-34, 35-44, 45-54, 55-64, 65+) • Household Size (1, 2, 3, 4, 5+) • Income (<$30k, $30k-$75k, >$75k) • Categories with few observations combined
Sample vs. Austin • Workers are under-represented (nearly 2 to 1). • Students are very over-represented.
Yearly VMT and Fuel Use • Both increase as… • Distance to CBD increases • Age increases • Both decrease as… • Education level rises • Number of children increases • Number of transit stops increases
Home Size and Monthly kWh (WLS) • Both increase as… • Income increases • Household size increases • Both decrease as… • The area grows denser • Older homes tend to be smaller but use more electricity. • College graduates tend to have smaller home sizes.
Opinions on Climate Change(Binary Probit) • Regulations preferred by… • Women • Homeowners • Adaptation preferred by… • Workers • Households with many vehicles • Those with older homes acknowledge the importance of both regulations and adaptation.
Energy Reduction Strategies • CAPPING is preferred by… • Households with many vehicles • Older respondents • Workers • TAXATION is preferred by… • College graduates • Large households • Homeowners
Conclusions • Long-term behavioral changesare difficult to implement. • Most agree climate change is a concern, but are unwilling to change their own behavior. • Increasing income and education lead to greater (stated) concern about one’s impact on the environment.
Conclusions (2) • Electricity usageincreases by 77 kWh/month for an additional person in a household & by 49 kWh/month for an additional 100 square feet of living space. • Average electricity consumptioncan be reduced by moving into newer, smaller homes. • Fuel consumptionincreases by 16.6 gallon/person with a one mile increase in driving distance to the CBD. • VMT per personper year increases by 307 miles with every additional mile a household lives from the CBD.
Thank Youfor your attention. Questions and Suggestions?