Initial Data Analysis
Initial Data Analysis. Derrick Hang February 10, 2010 Economics 201FS. The Data. Apple Inc. (AAPL): January 16, 1997 – January 7, 2009 2,920 Days IBM (IBM): April 9, 1997 – January 7, 2009 2,925 Days Proctor Gamble Co (PG): April 9, 1997 – January 7, 2009 2,924 Days


Initial Data Analysis
E N D
Presentation Transcript
Initial Data Analysis Derrick Hang February 10, 2010 Economics 201FS
The Data Apple Inc. (AAPL): January 16, 1997 – January 7, 2009 2,920 Days IBM (IBM): April 9, 1997 – January 7, 2009 2,925 Days Proctor Gamble Co (PG): April 9, 1997 – January 7, 2009 2,924 Days Price data available every minute from 9:35 AM to 3:59 PM for each trading day Based on volatility signature plots, an interval of 11 minutes was chosen
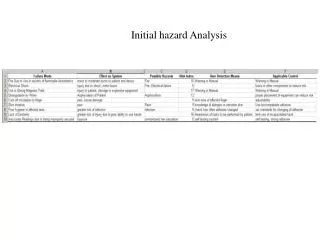
Outliers Apple Inc. (AAPL): January 6, 1998 11:04 AM January 10, 2005 12:44PM announcement of stock split IBM (IBM): No clear outliers Proctor Gamble Co (PG): January 20, 2000 1:37PM announcement of stock split July 1, 2003 1:18PM For this initial analysis, set 0bvious return outliers to zero. (Rationale: Stock splits, revolutionary product reveal, etc. do not happen that often; however, this should not be completely ignored in later analysis)
AAPL Signature Volatility PlotAgainst Average Annualized Realized Volatility Expressed as a Percent
IBM Signature Volatility PlotAgainst Average Annualized Realized Volatility Expressed as a Percent
PG Signature Volatility PlotAgainst Average Annualized Realized Volatility Expressed as a Percent
AAPL Jump Detection: Tri-Power • 1% Significance Level = 4 jump days • 5% Significance Level = 9 jump days • 10% Significance Level = 33 jump days
IBM Jump Detection: Tri-Power • 1% Significance Level = 0 jump days • 5% Significance Level = 0 jump days • 10% Significance Level = 25 jump days
PG Jump Detection: Tri-Power • 1% Significance Level = 0 jump days • 5% Significance Level = 7 jump days • 10% Significance Level = 28 jump days
AAPL Jump Detection: Quad-Power • 1% Significance Level = 17 jump days • 5% Significance Level = 49 jump days • 10% Significance Level = 107 jump days
IBM Jump Detection: Quad-Power • 1% Significance Level = 0 jump days • 5% Significance Level = 10 jump days • 10% Significance Level = 44 jump days
PG Jump Detection: Quad-Power • 1% Significance Level = 2 jump days • 5% Significance Level = 23 jump days • 10% Significance Level = 53 jump days