Download

1 / 25
310 likes | 1.01k Vues
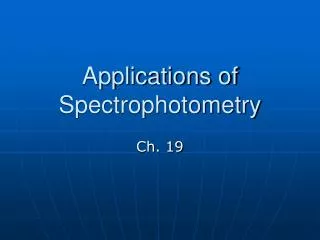
Spectrophotometry Chapter 17, Harris. Spectrophotometry is the use of the measurement of the interaction of Electromagnetic radiation (EMR) with matter to quantize the concentration of an analyte. There are many different types of

E N D
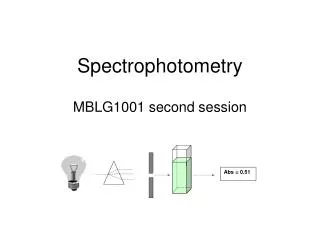
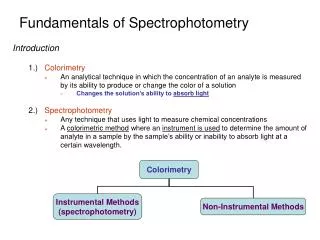
SpectrophotometryChapter 17, Harris Spectrophotometry is the use of the measurement of the interaction of Electromagnetic radiation (EMR) with matter to quantize the concentration of an analyte. There are many different types of spectrophotometers, based on the wavelength region of the EMR they measure. Examples are uv-vis, IR, microwave, x-ray, etc. spectra1
Electromagnetic Radiation Electromagnetic Radiation travels at the speed of light (c), 2.997 x 10⁸ m/s Monochromatic light has a very small wavelength spread or narrow bandwidth; one Polychromatic light has several wavelengths or in its beam.
Electromagnetic Radiation Frequency (, Greek nu): Number of peaks that pass a given point per unit time. Wavelength (, Greek lambda): Distance from one wave peak to the next. Wavenumber ~ = 1/, cm-1 Amplitude: Height measured from the center of the wave. The square of the amplitude gives intensity.
Plane polarized EMR consists of the sinusoidal electric field vectors in one plane with magnetic field vectors orthogonal to the electric field vectors. The above wave is traveling in the x direction in the above diagram.
Frequency and wavelength are related by c = = 2.997 X 10⁸m/s Energy and frequency are related by the expression E = h where h (Planck’s constant = 6.626 X 10⁻³⁴ J s)
Depending on the specific region of the EMR, various units are used to express the symbolRegion of EMR meter m radio millimeter mm microwave micrometer m infrared nanometer nm visible/ultraviolet Angstrom (10-10 m) Å X-ray picometer pm -ray
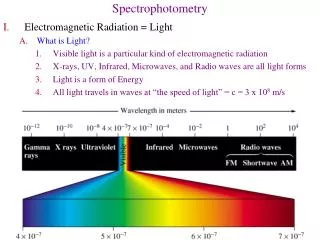
Different regions of the EM spectrum produce different types of transitions in molecules. Note the inverse relationship between wavelength and energy, i.e., the shorter the the greater the Energy.
The absorption of EM radiation increases the energy of the molecule in one of the ways described on the proceeding slide. Emission results when the molecule loses energy.
The visible spectrum is a very narrow region of the EMR spectrum. Note that the shortest is at the violet end of the visible spectrum. The ultraviolet region is to its left. The longest at the red end of the visible spectrum, and the infrared region is to its right.
Fundamental to all of the spectroscopic methods is the quantization of energy. • Let’s consider an atom first. • Atoms exist in discrete (or quantized) potential energy (PE) • levels. • The PE depends on the electronic configuration of the atom • Transitions of outer shell electrons between definite levels • occur at definite “sized” energy according to E = h • if E absorbed, the electron is excited to a higher level. • if E emitted, the electron falls to a lower level. • Thus, each transition occurs with a specific energy, or since • E = h = hc/, each transition gives rise to a specific spectral • line, either absorption or emission depending on the process.
Fundamental to all of the spectroscopic methods is the quantization of energy. Now, for a molecule, Energy TOTAL =Eelectronic + Evibrational + Erotational Where Eelectronic occursin the UV-Vis Evibrational in the IR, and Erotational in the microwave region of the EMR Electronic transitions are accompanied by fine structure, i.e., vibrational and rotational transitions.
The fine structure of vibrational transitions (v0 – v4 ) on the electronic E 0 – E1. Not shown would be the fine structure of rotational transitions within each vibrational level.
Transmittance and Absorbance There are two quantities that relate the change in the intensity of EM before and after interaction with matter. • Transmittance = P / P0, and • Absorbance, defined as A = log10 (P0 / P ) = - log10 (P/ P0 )
Beer’s Law Beer’s Law (or the Beer-Lambert Law) expresses the relationship between absorbance (A), the length of cell(b), and the concentration of the absorbing species (c). The proportionality constant is and is known the molar absorptivity. This relationship is given by the equation A = b c
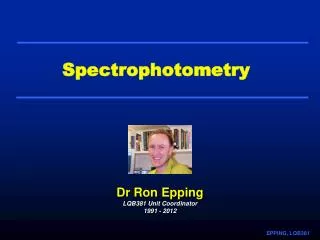
The absorption spectrum of a sunscreen lotion showing A as a function of of the EM radiation. This spectrum is in the ultraviolet (UV) region. UV-B is the shorter or higher energy and thus more harmful to skin.
Various typical cells (cuvets) used in spectrophotometry. The faces (part in the light path) may be silica, quartz, glass, or plastic, but must be transparent to the radiation of interest.
Analysis of analytes by spectrophotometry involves converting the analyte to a light-absorbing species. Pictured here is the chemistry for the analysis of the nitrite ion, NO2-.
A portion of the visible spectrum of the colored complex in the determination of nitrite.
Calibration curve for the analysis of nitrite. The of 543 nm and b (the pathlength of the cuvet) are kept constant