Conduct a Gap Analysis
Conducting a Comprehensive Needs Assessment. Conduct a Gap Analysis. Session Questions. How do schools and districts establish a focus for improving student performance? How do schools and districts compare their practices to those of high-performing schools/districts?

Conduct a Gap Analysis
E N D
Presentation Transcript
Conducting a Comprehensive Needs Assessment Conduct a Gap Analysis
Session Questions • How do schools and districts establish a focus for improving student performance? • How do schools and districts compare their practices to those of high-performing schools/districts? • How can honest and forthright dialogue be promoted among school/district staff about conditions that currently exist? 2
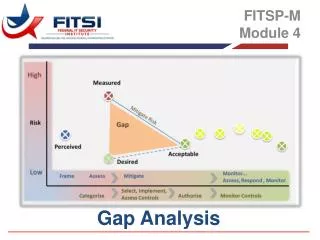
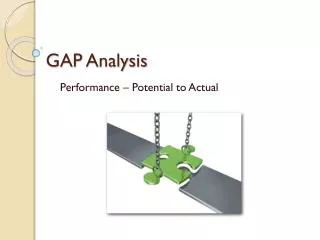
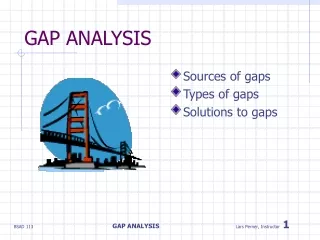
What Is a Gap Analysis? A way to compare current conditions and practices in a school and district to those in high-performing systems in order to identify gaps and areas in need of improvement 3
Critical Factors in School Improvement (CIASR) Curriculum Instruction Assessment Standards Resources 4
Content Area Focus We first need to determine the content area most in need of improvement: • Reading • Mathematics 5
Alignment Focus Area • Within this content area, where does the most pressing issue affecting student performance exist? • Standards • Curriculum • Instruction • Assessment • Resources 6
Coming to Consensus Write your table group’s alignment focus area (C, I, A, S, or R) selection on an index card. Each table, post your index card on the wall and be prepared to advocate for your table’s choice. 7
An Alternative Process for Working With School Leadership Teams Divide participants into 5 table groups and assign each group one of the alignment focus areas. • Groups discuss the status of the school in their focus area. • Each group shares its ideas with the whole group. • Participants advocate for the focus area they feel is most urgently in need of improvement. • Participants “vote,” using sticky dots, for their choice of the focus area to address for beginning the improvement work. 8
Using the Alignment Examination Tool Find the appropriate page of Handout 4 for the selected alignment focus area. Working individually, review the indicators in the left column, shown by research to be well supported in high-performing systems. 9
Individually… • Underline those elements of the high-performing indicators/hallmarks that are well supported in your school or district. • Circle those elements of the high-performing indicator/hallmarks that are challenges for your school or district. • Record justifications (evidence)in the right-hand column for the items that are underlinedand circled in the left-hand column. 10
Evidence of Support or Challenge • Recorder will now chart evidence showing that each indicator is either supported or represents a challenge for your system (district or school). • You have 15 minutes for this task. 12
Evidence of Support or Challenge Indicator Support Challenge Lesson plans reflect differentiated instruction Teachers tailor instruction to meet the individual needs of diverse learners. Content area instruction is clearly aligned with the standards, curriculum, and assessments. Teachers work together to create tests that assess lesson objectives Lesson plans frequently do not reflect the district curriculum 13
Number Line Example 0 25 50 75 100 14
Rating the System’s Current Status • Work individually. • Based on the evidence for those items that are underlined and circled, assign a value between 0 (no support) and 100 (consistent support); write the value on a small sticky note. • This rating is not necessarily an average, as some of the elements of the indicators may be more weighted and more important than others. 15
Rating Chart • 0 to 25 – There is little or no evidence of systemic support for activities or initiatives. • 26 to 50 – Activities are being implemented, but substantial gaps still exist in the system. • 51 to 75 – Supporting systems are in place, but implementation is not consistent. • 76 to 100 – System support is consistent and all stakeholders are included in activities and initiatives. Place your rating on the number line. 16
Number Line Example 30 30 25 30 40 25 30 40 50 25 30 40 50 20 25 30 40 50 75 10 20 25 30 40 50 60 75 85 90 0 25 50 75 100 17