Person
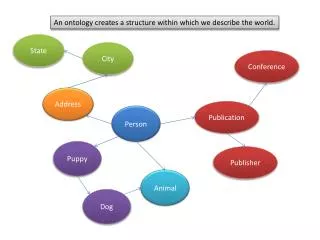
An ontology creates a structure within which we describe the world. State. City. Conference. Address. Publication. Person. Puppy. Publisher. Animal. Dog. The world as we choose to see it fits within that structure. WA. Walla Walla. ODBASE’09. 1045 Boyer. Not-gadgets. Paea. Tupa.


Person
E N D
Presentation Transcript
An ontology creates a structure within which we describe the world. State City Conference Address Publication Person Puppy Publisher Animal Dog
The world as we choose to see it fits within that structure. WA Walla Walla ODBASE’09 1045 Boyer Not-gadgets Paea Tupa LNCS Paea, Tupa Tupa
Data annotation, as we define it, is therefore the process of fitting real world entities into the ontology structure. Walla Walla Tupa ODBASE’09 Paea WA Not-gadgets LNCS
The power of ontologies is that the structure informs the data and vice-versa. That is, you can infer more data than you may have started with by extrapolating on the interplay between data and structure. Walla Walla Tupa ODBASE’09 Paea WA Not-gadgets LNCS Paea Tupa Tupa
RDF (resource description framework) is a language upon which OWL (the Web Ontology Language) is layered. Simply put, RDF helps to specify the fundamental structure of an ontology: which are relationships (arrows). Recall that an ontology forms a graph; well, RDF helps you write down the edges (arrows) of the graph. All you really need is a triple: subject (arrow start), property (arrow label), and object (arrow end). <Paea, hasPet, Tupa> But there’s actually more information hidden here than just the arrow you can see. The colored circles mean something too (they are “arrows” too – don’t trust the diagram!): Paea hasPet Tupa <Paea, hasType, Person> <Tupa, hasType, Dog>
Observation datatype: number has_value Measurement has_spatial_attribute has_unit has_measure IN-LOCC datatype: string