Download

1 / 46
480 likes | 775 Vues
Satellite Analysis of Tropical Cyclones in India. WMO International Workshop on Satellite Analysis of Tropical Cyclones (IWSATC), Honolulu Hawaii, 13 – 16 April 2011. Suman Goyal , Satellite Meteorology Division, India Meteorological Department, Suman_goyal61@yahoo.co.in.

E N D
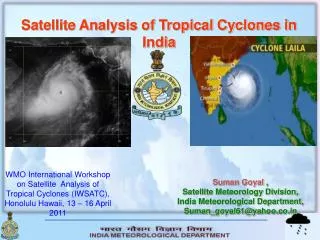
Satellite Analysis of Tropical Cyclones in India WMO International Workshop on Satellite Analysis of Tropical Cyclones (IWSATC), Honolulu Hawaii, 13 – 16 April 2011 Suman Goyal , Satellite Meteorology Division, India Meteorological Department, Suman_goyal61@yahoo.co.in
Presentation Layout • Introduction • Satellite operations in India • Tropical Cyclone Analysis in India • Problems and prospects • Future Aspects
SOME FACTS ABOUT CYCLONES Out of 80 global annual number - four form over Bay of Bengal – two / three intensify to severe ones Minimum No. of cyclones in a year - One (1949) Maximum No. of cyclones in a year – Ten (1893,1926,1930,1976) Out of total disturbances - 35% intensify to Cyclones 16 % intensify to SCS 7% intensify to VSCS Peak activity – November followed by May Ratio of TCS between Bay of Bengal and Arabian Sea – 4:1 Year to year variation - Quite large
SOME FACTS ABOUT CYCLONES (Cont’d) Most vulnerable coast in the West Coast - South Gujarat coast. Most vulnerable coast in the East Coast - 24 paraganas of West Bengal followed by Krishna & Nellore districts of AP. Life period of a Tropical Cyclone is 5-6 days. It will have hurricane intensity for 2-4 days as against 6 days of global average. Life period of the longest lived Tropical Cyclone in Indian seas is 14 days (2-15th Nov, 1886 & 16-29th Nov, 1964). Life period of the longest lived Hurricane Ginger over Atlantic is 31 days during 1972. Size of a Tropical Cyclone over Indian seas is 50-100 km radius to 2000km radius with average of 3º to 5º (300 –600km).
Frequency of Cyclonic systems over north Indian Ocean during 1891-2007
Introduction INTRODUCTION • India has been quite active in satellite meteorology. First Indian polar orbiting Satellite Aryabhatta was launched on 19 April 1975 followed by two other Indian polar orbiters, Bhaskar-1on 7th June 1979 and Bhaskar-2 on 20th November 1981 were launched. The first geostationary Indian Satellite with meteorological payload INSAT-1A was launched on 10th April 1982 and INSAT 1B on 30th August 1983 .
INSAT Series • INSAT -2A the indigenously built satellite launched by India on July 1992. • India launched INSAT -1D on June 1990. • INSAT -2B launched by India on July 1993. • INSAT -2E the last satellite of the series was launched by India on 26th May 1999. • KALPANA -1 Satellite was launched on September 2002 . • INSAT -3A launched on May 2003 by India.
Tropical Cyclone Analysis (1960-1974) • Tropical cyclone analysis in delayed mode started from 1960’s after the launch of TIROS-1 in 1960. • Tropical cyclone analysis in India on real time started from 1963 onwards after the establishment of APT service in Bombay • As the number of satellite increased and Nephanalysis bulletins from USA and USSR were also being received which improved the Tropical Cyclone analysis in India.
Tropical Cyclone Analysis (1960-1974) Contd…… • Pre Dvorak era (before 1975), Intensity was approximated by seeing the intensity and size of cloud pattern appearance of storm’s eye, its banding etc..
Tropical Cyclone Analysis (1975-1982) • Systematic method started from 1975 onwards on real time after the formulation of Dvorak technique which gained widespread acceptance • Initially Dvorak technique was based on pattern matching concepts and only visible imageries were used for analyzing the tropical systems.
Earliest Satellite Records • By using this technique, post-mortem studies were done for the cyclones for the period 1967-1971 by using pictures from the satellites ESSA-3, ESSA-9, ITOS-1 And NIMBUS-3 (D.K.Mishra, Hemraj, 1974) • Conclusions from these studies were quite different than those by Dvorak. It may be because of lack of measurement techniques.
Inter Agency Difference in Position and Intensity of the Vortex Example : GIRI over Bay of BengalDuring 20-22Oct, 2010
22 Oct 2010 0900 UTC Pattern: Eye Embedded Distance=0.35 Eno= 3.5 EAdj= 0 CF= Eno + EAdj =3.5 BF= 2.0 DT=CF+BF=5.5 This distance is : 0.35° deg Very Severe Cyclone GIRI
Other Inter Agency Differences • Some times systems were tracked by India Meteorological Department, but not by SSD NOAA and vice versa. • SSD NOAA is normally giving higher intensity at 2100 UTC as compared to IMD
Weaker Systems • In weaker system center determination is difficult .In such cases Scatterometric winds from Oceansat 2 and Microwave imageries are helpful . Some times multiple centers are also seen in the satellite imageries.
Limitations • Rapidly intensifying systems Dvorak technique fails. • According to Dvorak Final T no. limits < T4 change of half over 6 hours >T4 change of 1 over 6 hours Example : Tropical Cyclone “GIRI” from 20 to 22 Oct 2010. Maximum Intensity reached 5.5
Local variations to Dvorak (1984) T.No./C.I No. Wind Speed in Knots (Atlantic) Wind Speed in Knots (IMD) T1.0 25 <17 T1.5 25 25 T2.0 30 30 T2.5 35 35 T3.0 45 45 T3.5 55 55 T4.0 65 65 T4.5 77 77 T5.0 90 90 T5.5 102 102 T6.0 115 115 T6.5 127 127 T7.0 140 140 T7.5 155 155 T8.0 170 170
Limitation in Dvorak technique • The technique is subjective and there are systematic variations between analysts but they are being sorted out by mutual discussions. • Microwave imageries can be accessed through cyclone module of SYNERGIE and are helpful for centre determination.
Relation between Final intensity estimate and CI number • The CI is same as the final intensity for developing cloud patterns. • The CI differs from the final T-number for most weakening patterns, and also when redevelopment is indicated. • satellite imagery, use of Mcidas or similar) For weakening cyclone CI is same for 12 hours, then hold CI ½ or 1 higher than T number as storm weakens.
Objective analysis of tropical cyclones • In October 2009 ADT version 7.2.2 was installed in IMD with the help of SAC Ahmedabad. • As an example some results are shown:
CI Pressure-wind relationship is not changed . It is continuing since 1976. Mishra & Gupta formula : Vm = 14.2√∂p, where ∂P is Po – Pc (Pressure in outermost isobar – central pressure)
Criteria for best track record • Systems from T1.5 (Depression) onwards are entered in best track records but if Satellite Division declares T1.5 but Synoptic Division do not declares as Depression than it is not entered in best track.
SATELLITE BULLETIN DATED: 22/10/2010 TIME: 0300UTC TCIN50 DEMS 220300 SATELLITE BLLETIN BASED ON INSAT PIC OF 220300 UTC (.) AREA OF RESPONSIBILITY: EQ TO 40.0N LONG 60.0E TO 100.0E (.) SALIENT FEATURE: - VORTEX OVER EC ADJ NE BAY FURTHER INTENSIFIED AND NOW CENTRED AT 18.9N/92.9E (.) INTENSITY T5.0 REPEAT INTENSITY T5.0 (.) EYE VISIBLE (.) METEOSAT WINDS SHOWS WIND SHEAR IS BET 5 TO 10 KTS AND WIND SHEAR TENDENCY IS BET -10 TO –20 KTS SHOWS FURTHER CHANCES OF INTENCIFICATION (.) ASSTD BKN TO SOLID INT TO V INT CONVTN (CTT MINUS 81 DEG C) OVER BAY BET LAT 16.0N TO 21.0N EAST OF LONG 90.0E ARAKAN COT ADJ MYANMAR (.) BKN M/LAYERED CLOUDS OVER J&K ADJ PAK N HP EXT N PJB AND OVER AREA BET LAT 36.0N TO 47.0N LONG 74.0E TO 87.0E IN ASSW WD OVER THE AREA (.) NORTH: - SCT LOW/MED CLOUDS OVER REST PJB REST HP N UTRKND E UP ADJ W UP AND ISOL OVER W HARY (.) EAST: - BKN LOW/MED CLOUDS WITH EMBDD MOD TO INT CONVTN OVER S ASSAM AND E BD (.) BKN LOW/MED CLOUDS WITH EMBDD ISOL WK TO MOD CONVTN OVER REST PARTS OF THE REGIONAND BHUTAN EXCEPT SCT LOW/MED CLOUDS OVER BHR (.) WEST: - BKN LOW/MED CLOUDS WITH EMBDD ISOL WK TO MOD CONVTN OVER SE MP S M MAHA S KKN & GOA (.) SCT LOW/MED CLOUDS OVER REST MP REST MAHA N RAJ AND S GUJ (.) SOUTH: - BKN LOW/MED CLOUDS WITH EMBDD MOD TO INT CONVTN OVER E TLNGN RYLSM ADJ NIK COTL KRNTK ANDAMAN IDS AND LKSWDP (.) BKN LOW/MED CLOUDS WITH EMBDD ISOL WK TO MOD CONVTN OVER REST PARTS OF THE REGION EXCEPT SCT LOW/MED CLOUDS OVER S TN (.) Continue….
BAY OF BENGAL & ANDAMAN SEA: - SCT LOW/MED CLOUDS WITH EMBDD MOD TO INT CONVTN OVER REST EC BAY SW BAY AND WK TO MOD CONVTN OVER REST BAY ANDAMAN SEA GULF OF MARTABAN (.) ARABIAN SEA: - BKN LOW/MED CLOUDS WITH EMBDD MOD TO INT CONVTN OVER ARSEA BET LAT 9.5N TO 18.0N EAST OF LONG 67.0E (.) SCT LOW/MED CLOUDS WITH EMBDD ISOL WK CONVTN OVER REST S ARSEA (.) OUTSIDE INDIA: - BKN LOW/MED CLOUDS WITH EMBDD MOD TO INT CONVTN OVER N SUMATRA STR OF MALACCA AND OVER INDIAN OCEAN BET EQ TO 5.0N EAST OF LONG 90.0E (.) BKN LOW/MED CLOUDS WITH EMBDD ISOL WK TO MOD CONVTN OVER E TIBET ADJ CHINA REST MYANMAR ADJ THAILAND (.) TOO: 22/0940EF= TCIN51 DEMS 220300 INTENSE PRECIPITATION ADVISORY BASED ON INSAT PIC OF 220300 UTC (.) SCT INT PPTN LIKELY OVER J&K HP N PJB LKSWDP AP AND ISOL OVER KRNTK DURING NEXT SIX HOURS (.) TOO: 22/0942EF=
SPECIAL SATELLITE BULLETIN DATE: 22-10-2010 TIME: 0400 UTC TCIN50 DEMS 220400 SPL SAT BLTN BASED ON INSAT PIC OF 220400 UTC (.) VORTEX OVER EC ADJ NE BAY CENTRED AT 18.8N/92.8E (.) INTENSITY T4.5 (.) EYE VISIBLE (.) METEOSAT WINDS SHOWS WIND SHEAR IS BET 5 TO 10 KTS AND WIND SHEAR TENDENCY IS BET -10 TO –20 KTS SHOWS FURTHER CHANCES OF INTIFICATION (.) ASSTD BKN TO SOLID INT TO V INT CONVTN (CTT MINUS 81 DEG C) OVER BAY BET LAT 16.0N TO 21.0N EAST OF LONG 90.0E ARAKAN COT ADJ MYANMAR (.) TOO: 22/1015EF=
Future Prospects • INSAT-3D Satellite Scheduled to be launched in the 3rd quarter of 2011 • Payloads • It has a 6-channel Imager almost similar to GOES satellites of USA . • It has a 19 –channel Sounder similar to GOES satellites. • It has a Data Relay Transponder (DRT) similar to Kalpana-1 and INSAT-3A.
Megha-Tropiques mission of ISRO: Polar orbiting • To be launched in 2011 • It shall have the following payloads a) Microwave Analysis and Detection of Rain and Atmospheric Structures(MADRAS), with five channels of microwave for estimation of atmospheric water parameters in the equatorial belt. b) SAPHIR microwave humidity sounder and radiometer of 6 channels for humidity profile. c) SCARAB-broadband radiation measurement for measurement of Radiation fluxes.
Buoys Network Government of India has established a National Data Buoy Programme (NDBP) at National Institute of Ocean Technology (NIOT), Chennai. Under this programme, twelve moored data buoys have been deployed from August’97 to February ’98 at a sea depth of 20m to 4500m and spread over Bay of Bengal and Arabian sea. Since 2002, the number has increased to 25