Download
1 / 20
200 likes | 206 Vues
Welcome! Mass Spectrometry meets Cheminformatics Tobias Kind and Julie Leary UC Davis Course 6: Concepts for GC-MS. Class website: CHE 241 - Spring 2008 - CRN 16583 Slides: http://fiehnlab.ucdavis.edu/staff/kind/Teaching/. PPT is hyperlinked – please change to Slide Show Mode.

E N D
Welcome! Mass Spectrometry meets Cheminformatics Tobias Kind and Julie Leary UC Davis Course 6: Concepts for GC-MS Class website: CHE 241 - Spring 2008 - CRN 16583 Slides: http://fiehnlab.ucdavis.edu/staff/kind/Teaching/ PPT is hyperlinked – please change to Slide Show Mode
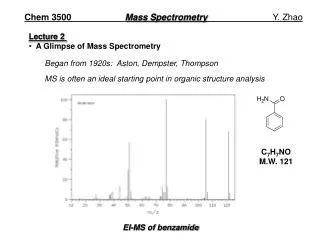
Gas chromatography-mass spectrometry Picture source: LECO ChromaTOF helpfile Picture source: Fiehnlab
100 75 50 25 0 0 2.00 4.00 6.00 8.00 10.00 12.00 14.00 16.00 18.00 20.00 22.00 100 75 50 25 0 30 40 50 60 70 80 90 100 110 120 130 140 150 160 170 Hyphenated techniques Most mass spectrometers are operated with liquid chromatography (LC) or gas chromatography (GC) to obtain better resolution of true compounds. High resolving power of mass spectrometers can not distinguish between isomers, hence chromatography is needed to separate the isomers or stereoisomers. Normalized Intensity Peak selector Chromatogram (GC-MS) Time [min] Normalized Intensity 166 Mass spectrum (EI) 97 129 83 61 47 35 119 70 112 m/z
Bad history: manual peak detection Historically people would manually go to the highest peaks in a chromatogram and investigate those few peaks (library search and structure elucidation). Example with around 20 eye detectable peaks and loss of small but pure peaks. Normalized Intensity Chromatogram (GC-MS) Time [min] Normalized Intensity Mass spectrum (EI) m/z
100 75 50 25 0 10.00 11.00 12.00 13.00 14.00 15.00 16.00 17.00 18.00 19.00 20.00 Automatic peak detection with Mass Frontier Problems with manual peak picking or by-eye selection: What if substance is very low abundant (hidden in the noise)? What if substance is very active or toxic but low abundant/low concentration? Why would you discard compounds which have a high peak purity or signal/noise ratio (S/N)? Solution: + automatic peak detection + automatic peak picking + extraction of clean peak (deconvolution) + automated mass spectral database search + automated interpretation of mass spectrum Example: Manually around 20 peaks Automatic peak detection 77 peaks Example with MassFrontier
Peak picking and mass spectral deconvolution • Automation can detect peaks under baseline • Automation can detect and clean overlapping (non-resolved) peaks Case (B) Case (A) Baseline Time [min] Extracted mass spectrum with red triangle above m/z Example with MassFrontier
General algorithm from AMDIS AMDIS analyses steps: 1. noise analysis, 2. component perception, 3. spectrum deconvolution, 4. compound identification. First AMDIS analyzes the background and calculates a noise level for later processing. After that, it analyzes the data for an increase of a special ion trace. If there is maxima also for other traces at the same time, is assumes there is a peak and shapes a model peak. In the next step it calculates a "clean" spectra for each peak. And at last it identifies the compound via a library search. Download free AMDIS and manuals and example data Source: www.amdis.net
Following ion traces Ion Traces: prominent peaks (unique or very high peaks) can be used to investigate peaks Total Ion Current (TIC) shows the sum of all mass spectral intensities (including noise) Example: Peaks @ m/z=194 and m/z=257
The noise Noise can come from different sources, GC column material or dirt or sticky material (matrix) Noise will be removed by the automated process. Its hard to do that manually. Example: Noise traces from m/z=355 (siloxanes or column bleed) and m/z=147
Deconvolution errors Problem: multiple peak pickings and deconvolution errors 5 peaks detected but should be one peak Solution: apply sensitivity or signal noise filter (S/N) False: Too many components detected Correct: single component detected
Peak extraction and transfer to library search Cleaned deconvoluted noise free peak is now transferred to NIST DB for library search Clean extracted spectra are coded in different color.
Further investigation of mass spectrumwith mass spectral interpreter Example: peaks 43-57-71-85-99 all delta 14 = CH2 – can lead to alkanes
Small specialized target libraries Concept: Will only annotate compounds of interest (T) Will discard all other compounds. 1) NISTEPA: 1086 compounds in the EPA's "list of lists". 2) NISTDRUG: 739 compounds in the Canadian AAFS Toxicology Section MS Database Committee and the Association of Official Racing Chemists libraries 3) NISTFF: 991 compounds in the Philip Morris flavor and fragrance collection 4) NISTTOX: 1213 compounds represented in Finnigan Corporation's Toxicological library. 5) NISTFDA: 415 compounds in an FDA collection of mass spectra 6) NISTCW: 62 compounds relevant to detection of chemical weapons Source: AMDIS Readme and www.amdis.net
Importance of fast scanning mass spectral detectors In order to deconvolute (separate/clean) overlapping peaks, enough mass spectra have to be acquiredto perform the mathematical calculations. With only one spectrum per second this is impossible. That requires: a) fast scanning detectors like time-of-flight (TOF) b) fast data acquisition hardware/software (DAC/ADC) The LECO TOF can acquire up to 500 mass spectra per second. For GC-MS 20 spectra/second sufficient for comprehensive GC (GCxGC) up to 200 spectra/sec needed Source: LECO ChromaTOF Helpfile
Comprehensive GCxGC-TOF-MS GCxGC means orthogonal two dimensional GC (not just two columns connected) Peaks are transferred via modulator oven/freezer from one column to another Better peak capacity, better signal noise, more peaks, more unknown compounds. Extracted mass spectrum Second Dimension GC Source: LECO ChromaTOF Helpfile LECO thermal modulator First Dimension GC
Analysis of explosives with GC-TOF-MS 1. Ethylene glycol dinitrate 2. Nitrobenzene 3. 2-Nitrotoluene 4. 3-Nitrotoluene 5. 4-Nitrotoluene 6. Nitroglycerin 7. 1,3-Dinitrobenzene 8. 2,6-Dinitrotoluene 9. 1,2-Dinitrobenzene 10. 2,4-Dinitrotoluene 11. 3,4-Dinitrotoluene 12. 1,3,5-Trinitrobenzene 13. 2-Methyl-4-nitroaniline 14. TNT 15. PETN 16. RDX 17. 4-Amino-2,6-dinitrotoluene 18. 3,5-Dinitroaniline 19. 2-Amino-4,6-dinitrotoluene 20. Tetryl Source: LECO ChromaTOF Helpfile / EPA Method 8090
The Last Page - What is important to remember: • GC-MS is used for molecules with less than 500 Da mass • In order to pass the gas chromatographic column compounds must be volatile enough • Automated peak picking and deconvolution is needed for GC-MS • 10 to 20 spectra per second scan rate are needed for very narrow GC peaks • Good mass spectral deconvolution (good statistics, separation of overlaps) Use of AMDIS target libraries good concept for complex samples
Tasks (22 min): Download AMDIS (http://chemdata.nist.gov/mass-spc/amdis/) and example files 1) Perform a simple deconvolution (open a data file) 2) Change analysis settings (under analyze settings) 3) Press run button 4) Transfer possible peaks to NIST-MS Search
Literature (12 min): An integrated method for spectrum extraction and compound identification from gas chromatography/mass spectrometry data Hardware and Software Challenges for the Near Future: Structure Elucidation Concepts via Hyphenated Chromatographic Techniques
Links: • Used for research: (right click – open hyperlink) • http://chemdata.nist.gov/mass-spc/amdis/ • http://www.highchem.com/chromatogram-processor/processing-of-extracted-spectra.html • http://www.leco.com/products/sep_sci/pegasus_4d/pegasus_4d.htm# • Of general importance for this course: • http://fiehnlab.ucdavis.edu/staff/kind/Metabolomics/Structure_Elucidation/