Model-based approach
Model-based approach. Purpose Improve understanding Optimization Control Macroscale approach Mannapperuma et al. (1991); Lammertyn et al. (2003) Geometry: intact fruit Gas transport coupled with respiration kinetics. Gas transport properties. Effective parameters. D eff. Liquid phase.

Model-based approach
E N D
Presentation Transcript
Model-based approach • Purpose • Improve understanding • Optimization • Control • Macroscale approach • Mannapperuma et al. (1991); Lammertyn et al. (2003) • Geometry: intact fruit • Gas transport coupled with respiration kinetics
Gas transport properties Effective parameters Deff Liquid phase 1-ε Ci,l ε Ci,g Gas phase • Macroscale approach • Volume-averaged parameter • Measurement • Biological variability • DCO2 > DO2 • Anisotropic diffusivity • Apparant values
Microscopic overview of tissue • Parenchyma tissue structure • Grouped cells • Random distribution of cells and pores • Cell wall • Plasma membranes • Transport phenomena • Geometry required • Two phases • Gas • Liquid • Cell membrane • Passive transport • Active transport • Intra-cellular enzymatic reactions Plant Cell wall (Albert et al., 1994)
Objective • To verify the applicability of a microscale modelling approach to the gas transport at tissue level in a multiscale framework • To quantify the pathways of gas transport in relation to the microstructure of fruit tissue
Microscale modelling of gas transport in pears Q. Tri Ho, Hibru K. Mebatsion, Bert E. Verlinden, Pieter Verboven, Stefan Vandewalle and Bart M. Nicolaï
Geometry model • Light microscopy images • Parenchyma tissues of ‘Conference’ pear • Resolution 1pixel~0.735µm • Digitization of image • Geometry model generation (Mebatsion et al, 2006) • Ellipse tessellation algorithm
TEM image of Conference pear Cells • Ellipse tesselation Cell Intercellular space Cell wall
Concept of gas transport Liquid Pore O2,g ADP +Pi O2,l ATP synthase Mitochondrion ATP Cytosol CO2,l Work ATP CO2,g HCO3- Gas exchange of fruit Air filled intercellular space At the interface Intra-cell
Model of O2 transport in tissue • Assumption • Cell wall was assumed gas phase with effective diffusivity DO2,w • Passive gas transport through cell membrane • Henry’s law at the inter-phase • Model equation (Fick’s second law of diffusion) • Pore, cell, cell wall (i= pore, cell, cellwall) • O2 consumption at intra-cell • Michaelis-Menten reaction • Flux through cell membrane • with C*O2,l the equilibrated O2 concentration outside of the membrane
Model of CO2 transport in tissue CO2,l CO32- HCO3- Fraction of spieces H2CO3 pH • Fraction of CO2 spieces in liquid phase
Model of CO2 transport in tissue O2 Mitochondrion k1 H2CO3 CO2,l + H2O k2 ka1 HCO3- +H+ CO2,g • In pore, cell wall: the same as Eq of O2 • In cellular liquid phase
Physical parameters of microscale model (1)Lide (1996), (2) Gunning and Steer (1996), (3) Uchida et al. (1992), (4)Geers and Gros (2000), (5) Jolly (1991)
Numerical solution C2 Ltissue C1 • Meshing • 125050 elements • Solution • Finite element method • Comsol 3.3 (Comsol AB, Stockholm) • Estimation of Dtissue, eff • Steady state • Boundary condition • Side 1: C1 ; Side 2: C2 Isolated boundary
Results • Simulation of O2 transport
Effect of vacuole in the model • Occupy 30-90% of cell volume • Storage function • Maintain internal acidic pH • Lumped pH intra-cell model • Constant pH in the cell (DH+=9.3×10⁻⁹ m2/s, Geers and Gros, 2000) • pHintra-cell=5 • Model with vacuole • Constant pH in the cytoplasm and vacuole • Regulation of pH in the cytoplasm and vacuole • pHcytoplasm=7, pHvacuole=4.82
Comparison of lumped pH intracellular model and intra-cell including vacuole
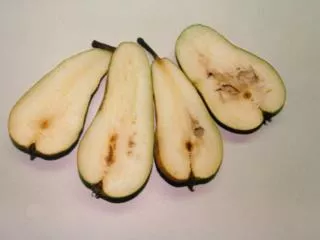
Estimated O2 diffusivity of pear tissue DO2,cell wall =5×10⁻⁹ m2/s Cell wall thickness= 0.73 µm (TEM, Mebatsion 2006, unpublished data) 9 different geometries
Estimated CO2 diffusivity of pear tissue Dw, CO2cell= 5×10⁻⁹m2/s Cell wall thickness= 0.73 µm (TEM, Mebatsion 2006, unpublished data) 9 different geometries
Current work • Toward 3D model • Digitization vs. mapping X-ray image Digitial geometry Mapping parameters 13853 elements 16896 elements
Solution using mapping parameters Solution based on digitial geometry DO2=1.29e-9 m2/s Solution using mapping parameters DO2=1.33e-9 m2/s
3D geometry based on mapping • Geometry information • Synchrotron X-ray tomography • Resolution 1 pixel~1.4µm • Pore distribution
3D geometry based on mapping • Geometry meshing • Lagrange-linear cube • Edge dim ~ 2.8µm • Nr of elements: 3968750 (3968750 DOFs) • Solving • Comsol script 1.1 (Comsol 3.3) • GMRES • HPC Clusters • CPU freq: 2000-2400 MHz • Used Mem: 5792736kb • Processing time: 12.25h
3D geometry based on mapping • Postprocessing • Scripts written in Matlab • Running on cluster • CPU freq: 2000-2400 MHz • Used Mem: 6.5 Mb
Primary 3D simulation CO2,gas (mol/m3) CO2,l (mol/m3) • O2 diffusion in tissue O2 gas concentration O2 liquid concentration
Primary 3D simulation CO2,gas (mol/m3) • O2 diffusion in different tissues Cortex Epidermis Subepidermis
Conclusions • A model was presented to study gas transport at the microscale • O2 mainly transports in the gas phase of intercellular space and cell wall networks • CO2 transfer in both gas and liquid phase • Macroscopic diffusivity was estimated using microscale simulations • Future: 3D simulations based on synchrotron X-ray tomography 500 micron