Download
1 / 67
670 likes | 844 Vues
Turnout ABMs & Social Networks. James Fowler University of California, San Diego. Habitual Voting and Behavioral Turnout. Turnout is the “paradox that ate rational choice theory” (Fiorina 1990) Bendor, Diermeier, and Ting (2003) develop behavioral ABM Advantages Innovative

E N D
Turnout ABMs &Social Networks James Fowler University of California, San Diego
Habitual Voting and Behavioral Turnout • Turnout is the “paradox that ate rational choice theory” (Fiorina 1990) • Bendor, Diermeier, and Ting (2003) develop behavioral ABM • Advantages • Innovative • High turnout, other realistic aggregate features • Disadvantages • Behavioral assumption biases result towards high turnout • Causes individuals to engage in casual voting instead of habitual voting (Miller and Shanks 1996; Plutzer 2002; Verba and Nie 1972) • “Moderating feedback” in the behavioral mechanism affects the BDT model • I develop an alternative model (JOP 2005) without feedback • yields both high turnout and habitual voting
BDT Behavioral Model of Turnout • Finite electorate with nD>0 Democrats, nR>0 Republicans who always vote for their own party • Each period t an election is held in which each citizen i chooses to vote (V) or abstain (A), given a propensity to vote • Election winner is party with highest turnout • Payoffs (πi,t)
BDT Behavioral Model of Turnout • Voters also have aspirationsai,t • Propensity adjustment (Bush and Mosteller 1955) • If πi,t ≥ai,t then • If πi,t <ai,t then where • Aspiration adjustment (Cyert and March 1963) • where
Moderating Feedbackin the BDT Model of Turnout • Expected propensity: • Stable only if which is true iff • 50% success rate → 50% turnout! • Adaptive aspirations + monotonicity = bias towards high aggregate turnout
Voting is Habitual, Not Casual • Validated Turnout in the 1972, ‘74, ‘76 NES Panel Survey • South Bend (1976-1984)
Distribution of Individual Turnout Frequency in South Bend (1976-1984) vs. Turnout Frequency Predicted by BDT Model of Turnout
An Alternative Behavioral Model of Turnout • New propensity adjustment parameter • If πi,t ≥ ai,t then • If πi,t < ai,t then • BDT computational model is a special case when = 1 • Proposition 1. If the speed of adjustment () is not too fast then there exists a range of propensities such that for > 0 there is moderating feedback and for = 0 there is no feedback • Corollary 1.1 (BDT computational model). If = 1, then all propensities are subject to moderating feedback • Corollary 1.2 (model without feedback). If = 0, then propensities in the range are not subject to moderating feedback
An Alternative Behavioral Model of Turnout • Expected propensity: • Notice that if = 0 ,then →E[pi,t+1] = pi,tregardless of the value of the prior propensity • No bias!
Distribution of Individual Turnout Frequency in South Bend (1976-1984) vs. Turnout Frequency Predicted by Behavioral Models of Turnout
Aggregate Turnout • Remarkably, 1/3 of the BDT voters continue to vote even when c>b!
The Limits of Closed-Form Reason • Bendor argue that their propositions cover both the BDT and alternative model, so differences must be a mistake • However, key propositions based on assumption all voters have low (or all high) aspirations • These conditions never observed in 100,000 simulations with randomly drawn parameters
Lesson about Convergence • Bendor also refused to believe results at first because they had “played with” a step-adjustment rule • I used their own C code to show them that if they waited long enough, it would generate my results • Need a way to assess convergence! • Fortunately, we know this process is ergodic
CODA library for Markov Chains • Brooks-Gelman (1997) • start more than one chain at divergent starting points • check within variance vs. between variance • when ratio is near one (<1.1), you’ve reached convergence • Geweke (1992) • Test for equality of the means of the first and last part of a Markov chain
CODA library for Markov Chains • Raftery and Lewis (1992) • Run on a pilot chain • Takes into account autocorrelation to suggest how long to run iteration • q - quantile to be estimated • r - desired margin of error of the estimate • s - probability of obtaining an estimate in interval (q-r,q+r) • Heidelberger and Welch (1982) • Tests the null hypothesis that the sampled values come from a stationary distribution using Cramer von Mises statistic
Summary and Conclusion • BDT model • Feedback biases it towards high turnout • Feedback yields casual voting • Alternative model • generates high turnout (albeit at a lower cost) • yields habitual voting • Warning for future work in “formal behavioralism” • 1950s and 1960s psychologists studied stochastic learning rules • 1970s rules abandoned because they could not explain individual-level behavior • Lesson: look at both population and individual levels!
Computational vs. Analytical Results • Argument appears in two places • Parties, Mandates, and Voters: How Elections Shape the Future (with Oleg Smirnov) 2007 • “Policy-Motivated Parties in Dynamic Political Competition,” JTP 2007 • Errors occur in both proofs and programs • e.g. Roemer 1997 corrects errors in Wittman 1983 • Computer forces consistency in programs • program may not run • Humans must catch mistakes in proofs
Numerical Comparative Statics • Given no errors in proof, comparative statics for a given parameter space are certain • Claim: f(a,b) is always increasing in a. • Proof: df(a,b)/da > 0 • Given no errors in program, comparative statics for a given parameter space are uncertain • But we can estimate the uncertainty by sampling the parameter space
Estimating Uncertainty of Computational Claims • For one set of parameters • Claim: f(a,b) is always increasing in a • Test: if f(a + ε,b) ≤ f(a,b) then claim is contradicted • For n i.i.d. sets of parameters • Let p be the portion of the space that contradicts the claim • Probability of not contradicting claim is (1 – p)n • To be 95% confident of our estimate of p, let (1 – p)n=0.05, • Implies p = 1 – 0.051/n or approximately 3/n • No observed failures means we can be 95% confident that 3/n part of the space (or less) contradicts the claim
Numerical Comparative Statics • Draw n = 100,000 sets of parameters • If a claim is not falsified, we can be 95% confident that only 0.003% (or less) of the parameter space contradicts the results • We use this method to characterize numerically propositions in a dynamic model of party competition with policy-motivated parties
Some Network Terminology • Each case can be thought of as a vertex or node • An arc i j = case i cites case j in its majority opinion (directed or two-mode network) • An arc from case i to case j represents • an outward citation for case i • an inward citation for case j • A tie i j = nodes are connected to one another (bilateral or symmetric network) • Total arcs/ties leading to and from each vertex is the degree • in degree = total inward citations • out degree = total outward citations
Clustering Coefficient • What is the probability that your friends are friends with each other? • Network level • Count total number of transitive triples in a network and divide by total possible number • Ego level • For ego-centered measure, divide total ties between friends by total possible number
Degree Centrality • Degree centrality = number of inward citations(Proctor and Loomis 1951; Freeman 1979) • InfoSynthesis uses this to choose cases for its CD-ROM containing the 1000 “most important” cases decided by the Supreme Court • However, treats all inward citations the same • Suppose case a is authoritative and case z is not • Suppose case a i and case z j • Implies i is more important than j
Eigenvector Centrality:An Improvement • Eigenvector centrality estimates simultaneously the importance of all cases in a network (Bonacich 1972) • Let A be an n x n adjacency matrix representing all citations in a network such that aij = 1 if the ith case cites the jth case and 0 otherwise • Self-citation is not permitted, so main diagonal contains all zeros
Eigenvector Centrality:An Improvement • Let x be a vector of importance measures so that each case’s importance is the sum of the importance of the cases that cite it:xi = a1i x1 + a2i x2 + … + ani xnorx = ATx • Probably no nonzero solution, so we assume proportionality instead of equality:λxi = a1i x1 + a2i x2 + … + ani xnor λx = ATx • Vector of importance scores x can now be computed since it is an eigenvector of the eigenvalue λ
Problems with Eigenvector Centrality • Technical • many court cases not cited so importance scores are 0 • 0 score cases add nothing to importance of cases they cite • citation is time dependent, so measure inherently biases downward importance of recent cases • Substantive • assumes only inward citations contain information about importance • some cases cite only important precedents while others cast the net wider, relying on less important decisions
Well-Grounded Cases • How well-grounded a case is in past precedent contains information about the cases it cites • Suppose case h is well-grounded in authoritative precedents and case z is not • Suppose case h i and case z j • Implies i is more authoritative than j
Hubs and Authorities • Recent improvements in internet search engines (Kleinberg 1998) have generated an alternative method • A hub cites many important decisions • Helps define which decisions are important • An authority is cited by many well-grounded decisions • Helps define which cases are well-grounded in past precedent • Two-way relation • well-grounded cases cite influential decisions and influential cases are cited by decisions that are well-grounded
Hub and Authority Scores • Let x be a vector of authority scores and y a vector of hub scores • each case’s inward importance score is proportional to the sum of the outward importance scores of the cases that cite it:λx xi = a1i y1 + a2i y2 + … + ani ynorx = ATy • each case’s outward importance score is proportional to the sum of the outward impmortance scores of the cases that it cites:λy yi = ai1x1 + ai2x2 + … + ain xnory = Ax • Equations imply λx x = ATAxand λy y = AATy • Importance scores computed using eigenvectors of principal eigenvalues λx andλy
Closeness Centrality • Sabidussi 1966 • inverse of the average distance from one legislator to all other legislators • let ij denote the shortest distance from i to j • Closeness is
Closeness Centrality • Rep. Cunningham 1.04 • Rep. Rogers 3.25
Betweeness Centrality • Freeman 1977 • identifies individuals critical for passing support/information from one individual to another in the network • let ik represent the number of paths from legislator i to legislator k • let ijk represent the number of paths from legislator i to legislator k that pass through legislator j • Betweenness is
Large Scale Social Networks • Sparse • Average degree << size of the network • Clustered • High probability that one person’s acquaintances are acquainted with one another (clustering coefficient) • Small world • Short average path length “Six degrees of separation” (Milgram 1967)
Scientific and Judicial Citations • Unifying property is the degree distribution • P(k) = probability paper has exactly k citations • Degree distributions exhibit power-law tail • Common to many large scale networks • Albert and Barabasi 2001 • Common to scientific citation networks • Redner 1998; Vazquez 2001 • Suggests similar processes • Academics may be as strategic as judges!
The Watts-Strogatz (WS) Model(Nature 1998) Order Chaos “Real”Social Network
Barabasi and Albert, Science 1999 Add new nodes to a network one by one, allow them to “attach” to existing nodes with a probability proportional to their degree Yields scale-free degree distribution Preferential Attachmentand the Scale Free Model
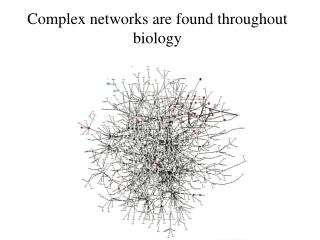
Ravasz and Barabasi 2003 Hierarchical Networks
Turnout in a Small World Social Logic of Politics 2005, ed. Alan Zuckerman • Why do people vote? • How does a single vote affect the outcome of an election? • How does a single turnout decision affect the turnout decisions of one’s acquaintances?
Pivotal Voting Literature • Most models assume independence between voters • Decision-theoretic modelsDowns 1957; Tullock 1967; Riker and Ordeshook 1968; Beck 1974; Ferejohn and Fiorina 1974; Fischer 1999 • Empirical modelsGelman, King, Boscardin 1998; Mulligan and Hunter 2001 • Game theoretic models imply negative dependence between votersLedyard 1982,1984; Palfrey and Rosenthal 1983, 1985; Meyerson 1998; Sandroni and Feddersen 2006
Social Voting Literature • Turnout is positively dependent • between spouses (Glaser 1959; Straits 1990) • between friends, family, and co-workers Lazarsfeld et al 1944; Berelson et al 1954; Campbell et al 1954; Huckfeldt and Sprague 1995; Kenny 1992; Mutz and Mondak 1998; Beck et al 2002 • Influence matters • many say they vote because their friends and relatives vote (Knack 1992) • Mobilization increases turnout • Organizational (Wielhouwer and Lockerbie 1994; Gerber and Green 1999, 2000a, 2000b) • Individual -- 34% try to influence peers (ISLES 1996)
Turnout Cascades • If turnout is positively dependent thenchanging a single turnout decision may cascade to many voters’ decisions, affecting aggregate turnout • If political preferences are highly correlated between acquaintances, this will affect electoral outcomes • This may affect the incentive to vote • Voting to “set an example”
Small World Model of Turnout • Assign each citizen an ideological preference and initial turnout behavior • Place citizens in a WS network • Randomly choose citizens to interact with their “neighbors” with a small chance of influence • Hold an election • Give one citizen “free will” to measure cascade
Simplifying Assumptions • Social ties are • Equal • Bilateral • Static • Citizens are • Non-strategic • Sincere in their discussions
Model Analysis • Analytic--to a point: • Create Simulation • Analyze Model Using: • A Single Network Tuned to Empirical Data • Several Networks for Comparative Analysis