Heating/Cooling Curves & Q= mC Δ T
410 likes | 1.42k Vues
Heating/Cooling Curves & Q= mC Δ T. ENERGY!!!. Energy: a measurement of the capacity of a system to do work or to transfer heat. Movement of Heat.

Heating/Cooling Curves & Q= mC Δ T
E N D
Presentation Transcript
ENERGY!!! • Energy:a measurement of the capacity of a system to do work or to transfer heat.
Movement of Heat Exothermic: A process that gives off heat to the surroundings. Heat is transferred tothe environment. DT is positive (temperature of object increased) heat
Endothermic: A process that absorbsheat from the surroundings. Heat is transferred fromthe environment. DT is negative (temperature of object decreased) heat
How do we feel “heat”? • The sensation of heat is due to a temperature difference • Heat is transferred from a region of highertemperature to a region of lowertemperature.
Heat: The energy that is transferred from one object to another because of a temperature difference. The direction of heat transfer is always from a hotter object to a colder object. • Temperature: a measurement of the average kineticenergy of the molecules in an object or system.
Hot object: particles moving faster • Cold object: particles moving slower • Thermal Equilibrium: When two or more objects in contact with one another reach the same temperature (particles moving at the same speed).
System vs. Surroundings • System: The part of the universe being studied (ie. A water molecule, a beaker of solution, a campfire). • Surroundings: Everything “outside” the system.
You witness an explosion…is this an example of an exothermic or endothermic process? Exothermic—the system releases heat to the surroundings!
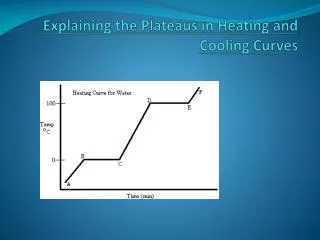
Similarities Both lines should have 3 regions: Initial temp change (while still a liquid) Plateau where temp stays the same (phase change- freezing point) Final temp change (while a solid) Differences Plateaus at a different temperature (substances have different freezing point temps) Plateaus are different length (may be short or long) Steepnessof graph during temperature change may differ Lesson 2: shape of the graph
Freezing of Lauric and Stearic Acids Freezing point = 68˚C Stearic Acid Lauric Acid Freezing point = 44˚C
Estimated freezing point of Stearic acid: 68°C Estimated freezing point of Lauric acid: 44°C
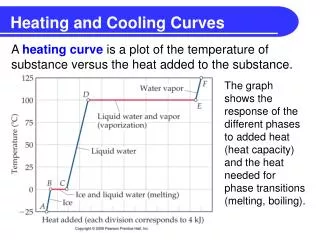
Phase Change Vocab (notes) • Freezing point(fusion) & melting point • temperature where solid↔ liquidphase change • water freezes at 0 ˚C, ice melts at 0 ˚C • Boiling point(vaporization) & condensationpoint • temperature where liquid↔ gasphase change • water boils (becomes gas) at 100 ˚C • water vapor (gas) also condenses to become liquid at 100 ˚C Unit 3 • Investigation I
Cooling Curve • On the graph below, label the areas which represent… • A gas cooling • A liquid cooling • A solid cooling • Condensation point (phase change from gas to liquid) • Freezing point (phase change from liquid to solid) • A time where both solid and liquid phases are present Temperature (˚C) Time Unit 3 • Investigation I
Check your work! • On the graph below, label the areas which represent… • A gas cooling • A liquid cooling • A solid cooling • Condensation point (phase change from gas to liquid) • Freezing point (phase change from liquid to solid) • A time where both solid and liquid phases are present Temperature (˚C) Time Unit 3 • Investigation I
Heating Curve • On the graph below, label the areas which represent… • A gas increasing in temperature • A liquid increasing in temperature • A solid increasing in temperature • Melting point (phase change from solid to liquid) • Vaporization point (phase change from liquid to gas) • A time where both liquid and gas phases are present Temperature (˚C) Time Unit 3 • Investigation I
Check your work! • On the graph below, label the areas which represent… • A gas increasing in temperature • A liquid increasing in temperature • A solid increasing in temperature • Melting point (phase change from solid to liquid) • Vaporization point (phase change from liquid to gas) • A time where both liquid and gas phases are present Temperature (˚C) Time Unit 3 • Investigation I
On the graph below, label the areas which represent… • A gas increasing in temperature • A liquid increasing in temperature • A solid increasing in temperature • Melting point (phase change from solid to liquid) • Vaporization point (phase change from liquid to gas) • A time where both liquid and gas phases are present E C A B D D
The boiling point of a substance is 87°C…at what temperature does it go from a gas to a liquid? 87°C! (The boiling point is the same as the condensation point!)
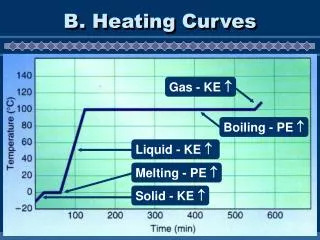
Cooling Curve Kinetic energy changes on the slanted portions of the graph while potential energy changes on the plateaus. Potential energy decreasing (molecules moving closer together) Temperature (˚C) Kinetic energy decreasing (molecules slowing down) Time Unit 3 • Investigation I
Heating Curve Potential energy increasing (molecules moving further apart) Temperature (˚C) Kinetic energy increasing (molecules speeding up) Time Unit 3 • Investigation I
Why does the temperature rise, fall or level off? • Sections where temperature changed… (rose or fell) Q: What happens to the molecules as they change temperature? A: During these times, the kinetic energy (KE) of the molecules changed. • They speed up or slow down when temp changes • Sections where no temperature change… (plateau) • kinetic energy stays the same (no temp change) • phase change is occurring • BUT, acid sample is still losing heat energy • What type of energy is lost? potential energy (PE) Unit 3 • Investigation I
Kinetic Energy changes as the temperature changes Lower temp Higher temp Kinetic Energy = energy of motion Higher temp = higher kinetic energy = moving faster
Potential Energy Change during phase change… • You can think of potential energy as the distancebetween the molecules • The molecules in a liquid are more spread out than those in a solid • so, during “melting”, the molecules spread out, potential energy increases Unit 3 • Investigation I
Check In - water heating curve Kinetic energy stays the same Kinetic energy increasing Unit 3 • Investigation I
A few more important notes… calorie: the amount of energy needed to heat one gram of water one degree (Celsius). Kilocalorie: unit we use to measure the energy in food(Calories) = 1000 calories J = Joules= a measure of energy kJ = Kilojoules = 1,000 J Conversion: 1 calorie = 4.184 Joules
Specific Heat Capacity:the heat energy required to increase the temperature of one gram of substance by one degree (Celsius or Kelvin) • Represented by symbol “C” • Units are Joules/gram*Kelvin or Joules/gram*Celsius
What is happening at the molecular level at point A? Particles are getting closer together—they are undergoing condensation (gas to liquid) A Temperature (˚C) Time Unit 3 • Investigation I
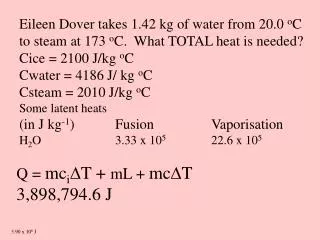
Energy needed to change temperature: Q = mCΔT Q = energy (J) m = mass (g) C = specific heat ΔT = change in temperature
Lesson 3: energy of temperature change Use Q = mCDT Q = energy (J) m = mass (g) C = specific heat (J/g˚C) DT = change in temp (˚C) Temperature (˚C) Note: the substance will have a different value for C (specific heat) depending on its phase (liquid, gas, etc…) Time Unit 3 • Investigation I
Sample Problem: A 622 g piece of copper metal is heated from 20.5°C to 324.3°C. Given that the specific heat of Cu is 0.385 J/g°C, calculate the heat absorbed (in J) by the metal. ΔT = 324.3°C – 20.5°C = 303.8°C Q = mCΔT = (622g)(0.385 J/g°C)(303.8°C) Heat absorbed = 72,750 Joules = 72.8 kJ
Practice: The specific heat of water is 4.18 J/g°C. How much energy is required to heat 45.0 grams of water from 15.5°C to 26.5°C? ΔT = 26.5 – 15.5 = 11°C Q = mCΔT = (45 g)(4.18 J/g°C)(11°C) = 2069.1 Joules = 2.07 kJ of energy
Lesson 4: energy of phase change DHv (change in heat for vaporization, liquid ↔ gas) How much energy is transferred during phase changes? (the plateaus on the graph) DHf (change in heat for fusion, liquid ↔ solid) Temperature (˚C) Time Unit 3 • Investigation I
Energy for Phase Changes ΔHf = Heat of fusion ΔHv = Heat of vaporization
Energy needed for Freezing/Melting (solid liquid): Qfusion = ΔHf x mol Energy needed for Vaporization/Condensing (liquid gas): Qvaporization = ΔHv x mol
Practice: The molar heat of fusion for water is 6,010 J/mol. Calculate how much energy is required to melt 3.00 moles of ice at 0°C. Qfusion = 6,010 J/mol x 3.00 mol = 18,030 J