Download
1 / 14
140 likes | 403 Vues
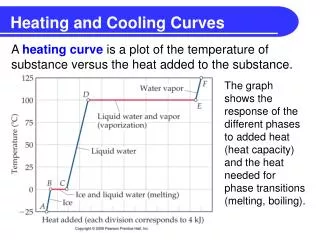
Heating and Cooling Curves continued. Harry S Truman Chemistry Dept. How does kinetic energy fit on the heating curve?. As the phase changes from solid to liquid or liquid to gas and entropy increases potential energy decreases

E N D
Heating and Cooling Curves continued Harry S Truman Chemistry Dept.
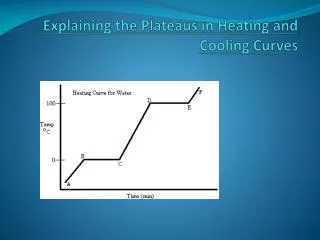
How does kinetic energy fit on the heating curve? • As the phase changes from solid to liquid or liquid to gas and entropy increases potential energy decreases • As the temperature increases, so does the kinetic energy (T = KE up) • During the flat portions of the heating curve and entropy increases and so does Potential Energy. (ΔS up = PE up) • If KE increases then PE stays constant and if PE increases then KE stays constant.
Which segments have an increase in KE? Which have an increase in PE? Which have an increase in ΔS?
What other curves do we have besides the heating curve? • Cooling Curve – shows the changes in phase, energy and temperature as a substance cools down over the course of time.
How does the cooling curve relate to the heating curve? • During the decline temperature is decreasing so kinetic energy is decreasing. (T down = KE down) • During the flat sections entropy is decreasing so potential energy is decreasing (ΔS and PE down) • The temperature at which a sample freezes is the same as which it melts (TM=TF) • The temperature at which a sample boils is the same at which it condenses (TB=TC)
Summary • The heating curve and cooling curve are similar yet opposite. They both show phase, energy and temperature changes, but in the cooling curve KE, T, PE andΔS all decrease (at different points). Freezing and melting both happen at the same temperature much like condensation and evaporation. VIDEO!!!