Download
1 / 25
931 likes | 3.19k Vues
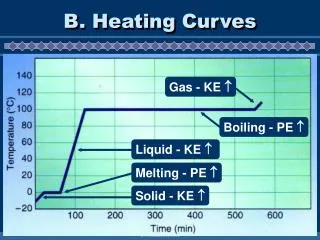
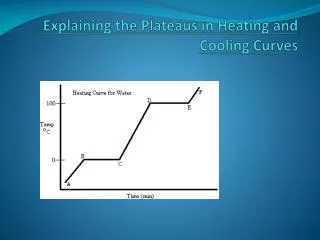
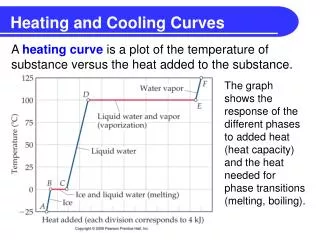
Heating and Cooling Curves. A heating curve is a plot of the temperature of substance versus the heat added to the substance. The graph shows the response of the different phases to added heat (heat capacity) and the heat needed for phase transitions (melting, boiling).

E N D
Heating and Cooling Curves A heating curve is a plot of the temperature of substance versus the heat added to the substance. The graph shows the response of the different phases to added heat (heat capacity) and the heat needed for phase transitions (melting, boiling).
Heating and Cooling Curves Different parts of the “curve” are referred to as segments. Segment AB shows what happens when heat is added to a block of ice starting at -25 C. Segment BC represents the melting of the ice.
Heating and Cooling Curves Why are some segments flat? Because it takes energy for phase transitions. During melting and vaporization, all the heat goes into breaking intermolecular interactions rather than increasing temperature.
Intermolecular Forces • Polar molecules attract one another because the oppositely charged parts of molecules attract one another. This is known as a dipole-dipole interaction. + - Covalent bond strength (Bond enthalpy) = 431 kJ/mol Dipole-dipole attraction strength = 2 -10 kJ/mol
Intermolecular Forces • Dipole-dipole forces can be repulsive as well as attractive.
O O O H H H H H H Intermolecular Forces • The attraction between two water molecules is very strong (5 - 25 kJ/mol). This special class of dipole-dipole interaction between water molecules is called hydrogen bonding. …. + …. -
Intermolecular Forces Melting or vaporizing a substance requires adding enough heat energy to disrupt the attractions between molecules (dipole-dipole interactions or hydrogen bonding). The 3-D structure of ice optimizes the hydrogen bonding.
Heats of Fusion and Vaporization • The energy needed to melt a substance is called the heat or enthalpy of fusion (Hfus). • The energy needed to vaporize a substance = the heat or enthalpy of vaporization (Hvap).
Heats of Fusion and Vaporization • Keep in mind an important property of H’s: • C4H10(s) C4H10(l) Hfus = 5 kJ/mol • C4H10(l) C4H10(s) H = -5 kJ/mol • C4H10(l) C4H10(g) Hvap = 24 kJ/mol • C4H10(g) C4H10(l) H = -24 kJ/mol
Heats of Fusion and Vaporization • Calculate the amount of heat needed to melt 75.0 grams of solid NaCl (at 800 C) if its enthalpy of fusion is 30.2 kJ/mol.
Heats of Fusion and Vaporization • Calculate the enthalpy change when 80.0 g of ethanol vapor (at 78 C) condenses if the enthalpy of vaporization of ethanol is 40.48 kJ/mol.
Heating and Cooling Curves For the flat segments: q = Hfus x moles or q = Hvap x moles
Heating and Cooling Curves For the sloped segments: q = m x Cs x T
Heating and Cooling Curves • Calculate the H need to convert a 40.0 g block of ice at -22.0 C to steam at 115 C. The specific heats of ice, water, and steam are 2.03 J/gK, 4.18 J/gK, and 1.84 J/gK respectively. For water, Hfus = 6.01 kJ/mol and Hvap = 40.67 kJ/mol.
Learning Check • Calculate the amount of heat needed to convert 60.0 g of liquid ethanol at 23.0 C to the same mass of ethanol vapor at 90.0 C. The boiling point of ethanol is 78.0 C. The molar heat capacities of liquid ethanol and ethanol vapor are 112.4 J/molK and 78.28 J/molK respectively. For ethanol, Hvap = 38.56 kJ/mol.
Heating and Cooling Curves A cooling curve is just a heating curve in reverse. It starts with a hot substance and shows what happens to the temperature when the substance is cooled (when it loses heat). You can construct a heating or cooling curve for any substance.
Phase Transitions • evaporation - spontaneous change from liquid to gas occurring at any temperature. • boiling - rapid formation of gas bubbles within a liquid. • boiling point - temperature at which the liquid and gas states are in equilibrium. Rapid formation of bubbles of vapor within the liquid due to vapor pressure of the liquid being the same as applied pressure.
Phase Transitions • normal boiling point - temperature at which the liquid and gas states are in equilibrium at 1 atm. Temperature at which vapor pressure of the liquid = 1 atm. • normal melting point - temperature at which solid and liquid states are in equilibrium at 1 atm. Temperature at which the substance melts at 1 atm.
Phase Transitions • triple point - temperature and pressure at which solid, liquid, and gas phases of a substance are all at equilibrium. • The triple point of water is 0.0098 C at 0.00603 atm. • critical point - temperature and pressure above which the distinction between gas and liquid disappears. Substances become supercritical fluids.
Phase Transitions • critical temperature - temperature above which a substance can no longer exist as a liquid regardless of the external pressure. • critical pressure - external pressure needed to keep a substance in the liquid state at the critical temperature (or liquify a gas at the critical temperature). • The critical point for CO2 is 31.1 C and 73.0 atm.
Phase Diagrams • A graph of pressure versus temperature that shows the phases of a substance and the pressure and temperature conditions for phase transitions is called a phase diagram. • You will need to be able to identify phases and phase transitions on a phase diagram.
Phase Diagrams normal m.p. normal b.p. normal sublimation point
Phase Diagrams List the states and/or phase transitions at the different points.