
Advanced Urine Profiling for Clinical Diagnosis Using LCMS and LDA Techniques
E N D
Presentation Transcript
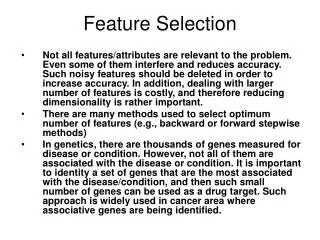
Urine profiling Prediction analysis (NSC, LDA, ROC) Cluster analysis Feature selection Classification Pattern analysis 2 3 1 Discovery set (17 medical, 17 Surgical) Discovery set (17 medical, 17 Surgical) LCMS raw spectra Peak finding peak alignment feature extraction NSC feature selection LDA Class prediction 2d hierarchical clustering heatmap plotting Predictors Ten-fold Cross-validation Analysis of goodness of class separation 13 peptide biomarker panel Urine peptide index ROC analysis 500 bootstrap samples FIGURE 1
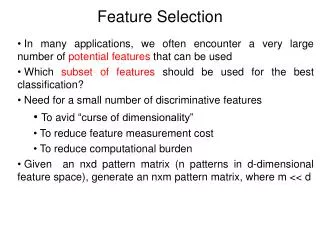
A B Testing Training Training set n = 20 Testing set n = 14 M S M S NEC NEC Clinical diagnosis Clinical diagnosis M S M S 10 10 7 7 n = n = LDA LDA Predicted probabilities Classified as M Classified as M 10 0 6 2 Classified as S 0 10 Classified as S 1 5 Percent Agreement with clinical diagnosis Percent Agreement with clinical diagnosis 100% 100% 85.7% 71.4% + - + - 100% 94.1% Overall P = 1.1E-5 Overall P = 0.1 Patient samples FIGURE 2
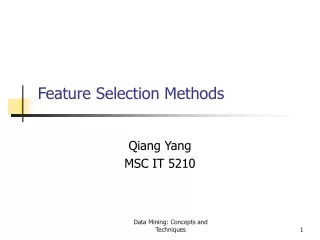
A B C NEC Discovery set n = 34 M S NEC Clinical diagnosis M S 17 17 n = Sensitivity LDA Predicted probabilities Classified as M 16 1 Classified as S 1 16 Mean(AUC): 98.5% Percent Agreement with clinical diagnosis 94.1% 94.1% + - 94.1% Overall P = 2.5E-7 Patient samples 1- Specificity FIGURE 2
8 6 4 Distribution density 2 0 0.65 0.70 0.75 0.80 0.85 0.90 0.95 1.00 ROC AUC values (500 permutations) FIGURE 2
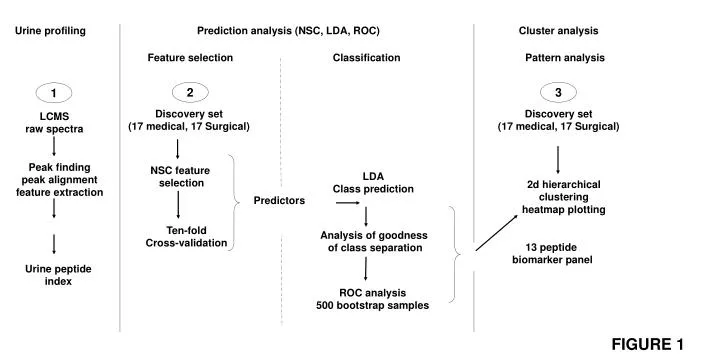
A NEC B M n=17 S n=17 Discovery set n = 34 NEC Clinical diagnosis M S 17 17 n = LDA Classified as M 11 0 Classified as S 6 17 Percent Agreement with clinical diagnosis 64.7% 100% + - 82.4% Overall P = 8.6E-5 FIGURE 2