Regression Diagnostics - I
Learn to diagnose regression analysis conditions and detect violations through residual analysis. Understand heteroscedasticity, autocorrelation, and how to identify outliers with practical examples.

Regression Diagnostics - I
E N D
Presentation Transcript
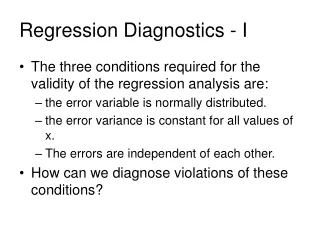
Regression Diagnostics - I • The three conditions required for the validity of the regression analysis are: • the error variable is normally distributed. • the error variance is constant for all values of x. • The errors are independent of each other. • How can we diagnose violations of these conditions?
Residual Analysis • Examining the residuals (or standardized residuals), help detect violations of the required conditions. • Example 17.2 – continued: • Nonnormality. • Use Excel to obtain the standardized residual histogram. • Examine the histogram and look for a bell shaped. diagram with a mean close to zero.
Standardized residual ‘i’ = Residual ‘i’ Standard deviation Residual Analysis A Partial list of Standard residuals For each residual we calculate the standard deviation as follows:
Residual Analysis It seems the residual are normally distributed with mean zero
^ y + + + + + + + + + + + + + + + + + + + + + + + ^ The spread increases with y Heteroscedasticity • When the requirement of a constant variance is violated we have a condition of heteroscedasticity. • Diagnose heteroscedasticity by plotting the residual against the predicted y. Residual + + + + + + + + + + + + + ^ + + + y + + + + + + + +
Homoscedasticity • When the requirement of a constant variance is not violated we have a condition of homoscedasticity. • Example 18.2 - continued
Non Independence of Error Variables Patterns in the appearance of the residuals over time indicates that autocorrelation exists. Residual Residual + + + + + + + + + + + + + + 0 0 + Time Time + + + + + + + + + + + + + Note the runs of positive residuals, replaced by runs of negative residuals Note the oscillating behavior of the residuals around zero.
Outliers • An outlier is an observation that is unusually small or large. • Several possibilities need to be investigated when an outlier is observed: • There was an error in recording the value. • The point does not belong in the sample. • The observation is valid. • Identify outliers from the scatter diagram. • It is customaryto suspect an observation is an outlier if its |standard residual| > 2
+ + + + + + + + + + + An influential observation An outlier + + … but, some outliers may be very influential + + + + + + + + + + + + + + The outlier causes a shift in the regression line