Sin3aRNAi Regulation: Insights from Cell Signaling Pathways
90 likes | 135 Vues
This study investigates the impact of sin3aRNAi on cell signaling pathways, focusing on Mmp1 expression and eye size variations. Analysis includes dCskRNAi interventions and Sin3a ChIP-Seq signals in conjunction with patient data. Additionally, the study explores Sin3A and Sin3B expression changes in cancer cells, highlighting potential therapeutic targets.

Sin3aRNAi Regulation: Insights from Cell Signaling Pathways
E N D
Presentation Transcript
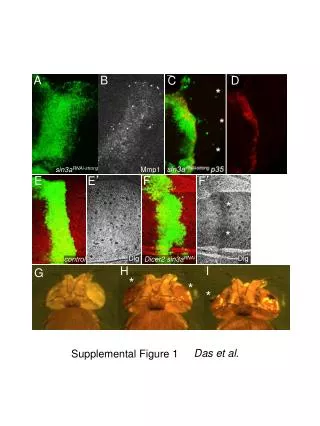
A B C D sin3aRNAi-strong Mmp1 E E’ F F’ E E’ F F’ * * Dlg Dlg Dicer2 sin3aRNAi control H I G * * * Das et al. Supplemental Figure 1
A’ B B’ A Mmp1 Mmp1 C C’ D D’ anti-Sin3a control anti-Sin3a dcr2 sin3aRNAi F E Relative Eye Size 1.6 1.5 1.4 1.3 1.2 1.1 1.0 0.9 0.8 * * * * dCskRNAi; sin3a-/+ dCskRNAi; mi-2-/+ control Das et al. Supplemental Figure 2 dCskRNAi(2); dCsk-/+ dCskRNAi dCskRNAi(2)
A A’ anti-Sin3a dcr2 dCskRNAi B B’ B’’ pSrc control C C’ C’’ pSrc dCskRNAi Supplemental Figure 3 Das et al.
Sin3a Binding peaks (+) strand genes (-) strand genes Chromosome 3R Sin3a ChIP-Seq Signal Supplemental Figure 4 Das et al.
Supplemental Figure 5 Das et al.
A Fold Change Sin3A expression Patient no. C FACS 14 14 18 Fold Change Sin3B expression 11 12 13 G2M S G1 sub-G1 66 71 72 B Patient no. siNTC siSin3A siSin3B siSIN3A strong siSIN3B strong siNTC siNTC A549 cancer cells SIN3B SIN3A 1 0.2 1 0.1 GAPDH GAPDH A549 cancer cells Das et al. Supplemental Figure 6
Supplemental Figure 7 Das et al.
A Csk C-Jun PP1β RhoA ß-Catenin Sin3A B 3 2 1 0 -1 -2 -3 C N=65 36 106 109 41 65 * gastric gastric gastric gastric gastric breast breast breast breast breast renal renal renal renal renal lung lung lung lung lung liver liver liver liver liver lym. lym. lym. lym. lym. normal tumor Supplemental Figure 8 Das et al.
B A MZ-CRC-1 cancer cells A549 cancer cells siSIN3(A+B) strong siSIN3(A+B) mild siSIN3(A+B) strong siSIN3(A+B) mild siSIN3A strong siSIN3A mild siSIN3B strong siSIN3A strong siSIN3A mild siSIN3B strong siNTC siNTC 2.5 1 1.5 pERK pERK pSRC Rac1 Rac1 pGSK3β α-Actin pGSK3β α-Actin C HEK293T cells siSIN3(A+B) strong siSIN3(A+B) mild siSIN3A strong siSIN3A mild siSIN3B strong siNTC pC-jun 1 1.5 pGSK3β Rac1 α-Actin Supplemental Figure 9 Das et al.