Impact of miR-185 Antagonism on Chemotherapy in Gastric Cancer Cells
Study on miR-185 levels with chemotherapy (CDDP, DOX) in MGC-803 cells, TUNEL positive cells, Cleaved Caspase-3, and b-gal activity.


Impact of miR-185 Antagonism on Chemotherapy in Gastric Cancer Cells
E N D
Presentation Transcript
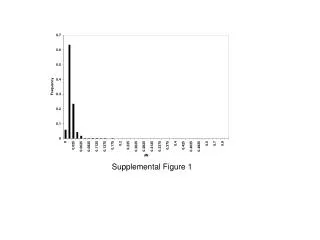
Supplemental Figure 1 c MGC-803 4 4 3 3 miR-185 levels (fold) 40 TUNEL positive cells (%) 2 2 1 1 20 0 0 60 60 0 – CDDP(30 mM) + + + TUNEL positive cells (%) 40 40 – – – miR-185 AntagomiR + – – – AntagomiR control 4 + 20 20 3 miR-185 levels (fold) 0 0 2 – – DOX (2 mM) + + + + + + – – – – – – f 1 + + miR-185 AntagomiR – – – – – – + + AntagomiR control 0 MGC-803 + miR-185 2 _ _ normal + b-gal 40 _ _ Cleaved Caspase-3 cancer TUNEL positive cells (%) 1.5 Actin 20 – Relative miR-185 levels DOX (2 mM) + + + 1 – – – miR-185 AntagomiR 0 + – – – + miR-185 – – – AntagomiR control + – – – + b-gal 0.5 – + + + CDDP (3 mM) 0 1 2 3 4 5 6 7 8 9 10 11 12 13 14 15 16 17 18 19 20 21 22 23 24 25 Patient Number e a d b