Download

1 / 5
50 likes | 154 Vues
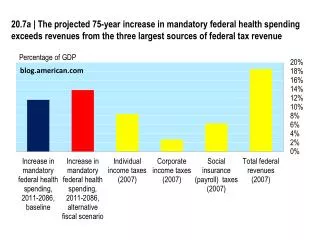
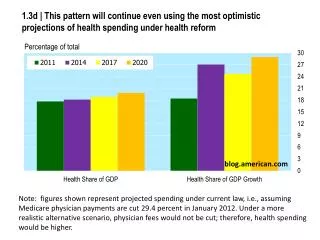
Compare performance percentages of Fort Worth students in state tests from 2006 to 2013 with demographic insights. Analyze reasons for passing rate changes and target specific causes for improvement.

E N D
FWISD Student PerformancePercentage of students passing state tests 2006-2013 Source: http://ritter.tea.state.tx.us/perfreport/tapr/2013/index.html
Comparative Demographics Ethnicity Dallas 23.7 African American; 69.4% Hispanic Houston 24.6% African American; 62.7% Hispanic Fort Worth 22.8% African American; 60% Hispanic Economically Disadvantaged Dallas 89% Houston 79.9% Fort Worth 77.2% English Language Learners Dallas 39.5% Houston 29.9% Fort Worth 29.6%
2005-6 District % passing Austin 62 Fort Worth 56 Houston 56 Dallas 54 San Antonio 53 2010-11 District % passing Austin 75 Houston 73 Dallas 67 Fort Worth 65 San Antonio 62 Changes 2006-2011
2010-11 TAKS District % passing Austin 75 Houston 73 Dallas 67 Fort Worth 65 San Antonio 62 2012-13 STAAR District % passing Austin 78 Houston 71 Dallas 69 Fort Worth 67 San Antonio 63 Changes 2011-13
Resolution • We need to analyze the reasons behind this situation • Implementation should be directed to the specific causes