Download
1 / 7
70 likes | 184 Vues
This report explores the complexities of a competitive game simulation focused on supply chain management. Participants are tasked with plotting weekly orders, inventory, and backlog while calculating total costs across four stages. The analysis includes graphical representations of costs over time and reflections on the game’s realism in comparison to real-world scenarios. Key discussion points cover production delays, accountability for issues faced during gameplay, and patterns observed in data across different teams, ultimately revealing insights into a simulated cost impact of $2885.

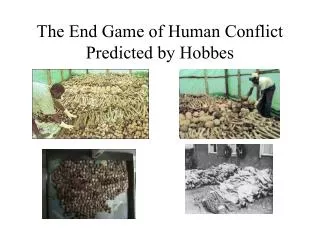
E N D
End of Game • Plot your Weekly Orders • Plot your Inventory and Backlog (back order is treated as minus inventory and plot them in the same graph) • Calculate Total Cost at your Stage • Sum Costs over all Four Stages and plot the costs of each stage over time • Please see slides 5, 6, 7 for examples of the graphs
Homework 2 Questions • What, if anything, is unrealistic about this game? Is reality more complicated or less complicated? • Why are there order, production and shipping delays?
Discussion • Did you find yourself “blaming” the person upstream for your problems? • What commonalities do you see in the graphs for the different teams?
Discussion • What pattern do you see? What is the cost of this?