Ligand Binding in Molecular Interactions
Learn about ligand binding, equilibrium, dissociation constants, and experimental techniques to determine binding affinity in biological systems. Key equations and relationships are explained, alongside practical methods for Kd measurement.

Ligand Binding in Molecular Interactions
E N D
Presentation Transcript
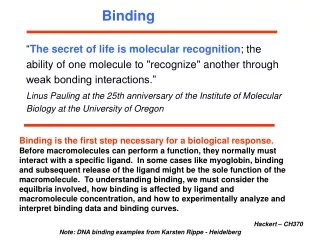
Binding “The secret of life is molecular recognition; the ability of one molecule to "recognize" another through weak bonding interactions.” Linus Pauling at the 25th anniversary of the Institute of Molecular Biology at the University of Oregon Binding is the first step necessary for a biological response.Before macromolecules can perform a function, they normally must interact with a specific ligand. In some cases like myoglobin, binding and subsequent release of the ligand might be the sole function of the macromolecule. To understanding binding, we must consider the equilbria involved, how binding is affected by ligand and macromolecule concentration, and how to experimentally analyze and interpret binding data and binding curves. Hackert – CH370 Note: DNA binding examples from Karsten Rippe - Heidelberg
Ligand Binding • General description of ligand binding • the essential terms and equations • thermodynamics • Simple equilibrium binding • stoichiometric titration • equilibrium binding / dissociation constant • techniques to determine K • Complex equilibrium binding • Multiple sites / cooperativity • Scatchard plots and Hill Plots
What is the meaning of the dissociation constant (Kd) for binding of a single ligand to its site? 1.Kd has units of concentration, mol / liter 2.Kd gives the concentration of ligand to saturate 50% of the ligand binding sites (when the total site concentration is much lower than Kd) 3.Almost all binding sites are saturated when the free ligand concentration is 10 x Kd 4.The dissociation constant Kd is related to Gibbs free energy ∆Go by the relation ∆Go = - R T lnKd
Summary of Key Equations / Relationships E + S ES ; for single site Rate of formation: [E][S] x kon Rate of breakdown: [ES] x koff Kd = koff / kon = [E][S]/[ES] and Ka = 1/ Kd DSo/ R van’t Hoff Equation Slope = -DHo / R ln K -DHoDSo lnK =+ RT R 1/T
Kd values in biological systems Movovalent ions binding to proteins or DNA have Kd 0.1 mM to 10 mM Allosteric activators of enzymes e. g. NAD have Kd 0.1 µM to 0.1 mM Site specific binding to DNA Kd 1 nM to 1 pM Trypsin inhibitor to pancreatic trypsin protease Kd 0.01 pM Antibody-antigen interaction have Kd 0.1 mM to 0.0001 pM
Summary of Key Equations / Relationships • E + S ES ; for single site • Kd = koff / kon = [E][S]/[ES] and Ka = 1/ Kd • define Fractional Occupancy of sites • q = [ES]/[Eo] = [ES]/([E] + [ES]) x [S]/[S] x [ES]/[ES] • then q = [S]/(Kd + [S]) • thus when [S] = Kd , then q = 0.50 • when [S] = 4Kd , then q = 0.80 • when [S] = 10Kd , then q = 0.91 • Note: [S] = conc. of free ligand!!
Kd << [M] Very tight binding
Simplification of Key Equations E + S ES ; Kd = koff / kon = [E][S]/[ES] and Ka = 1/ Kd So = S + ES; Eo = E + ES If So >> Eo , then S ~ So then Kd [ES] = [Eo – ES][So] [ES] = EoSo/(Kd + So); define Fractional Occupancy of sites q = [ES]/[Eo] = [ES]/([E] + [ES]) = [So]/(Kd + [So]) thus when [So] = Kd , then q = 0.5
Manipulations of Equations a) double reciprocal plot 1/q = Kd/ So + 1 ; plot 1/q vs. 1 / So b) Scatchard Plot: q = So/(Kd + So) or qKd + qSo = So or q = 1 - qKd/So plot q vs. q/So slope = - Kd
EXPERIMENTAL DETERMINATION OF Kd • TECHNIQUES THAT REQUIRE SEPARATION OF BOUND FROM FREE LIGAND – Care must be given to ensure that the equilibrium of M + L <==> ML is not shifted during the separation technique. • gel filrationchromatography - Add M to a given concentration of L. Then elute the mixture on a gel filtration column, eluting with the free ligand at the same concentration. The ML complex will elute first and can be quantitated . If you measure the free ligand coming off the column, it will be constant after the ML elutes with the exception of a single dip near where the free L would elute if the column was eluted without free L in the buffer solution. This dip represents the amount of ligand bound by M. • membrane filtration - Add M to radiolableled L, equilibrate, and then filter through a filter which binds M and ML. For instance, a nitrocellulose membrane binds proteins irreversibly. Determine the amount of radiolabeled L on the membrane which equals [ML]. • precipitation- Add a precipitating agent like ammonium sulfate, which precipitates proteins and hence both M and ML. Determine the amount of ML.
EXPERIMENTAL DETERMINATION OF Kd • TECH. THAT DO NOT REQUIRE SEPARATION OF BOUND FROM FREE LIGAND • equilibrium dialysis - Place M in a dialysis bag and dialyse against a solution containing a ligand whose concentration can be determined using radioisotopic or spectroscopic techniques. At equilibrium, determine free L by sampling the solution surrounding the bag. By mass balance, determine the amount of bound ligand, which for a 1:1 stoichiometry gives ML. Repeat at different ligand concentrations. • gel shift assay – Use autoradiography and gel electrophoresis with radiolabeled macromolecule. • spectroscopy - Find a ligand whose absorbance or fluorescence spectra changes when bound to M. Alternatively, monitor a group on M whose absorbance or fluorescence spectra changes when bound to L.
Scatchard equation: r/c = K(n-r) • Scatchard plot - determine the equilibrium association constant and valence of an antibody. • r = moles bound ligand/mole antibody at equilibrium; • c = free ligand concentration at equilibrium; • K = equilibrium association constant; and • n = number of antigen binding sites per antibody molecule
Analysis of binding of RNAP·s54 to a promoter DNA sequence by measurements of fluorescence anisotropy Rho Rho RNAP·s54 + free DNA with a fluorophore with high rotational diffusion -> low fluorescence anisotropy rmin promoter DNA Kd RNAP-DNA complex with low rotational diffusion -> high fluorescence anisotropy rmax RNAP·s54-DNA-Komplex
How to measure binding of a protein to DNA?One possibility is to use fluorescence anisotropy z vertical excitation filter/mono- chromator polarisator sample x Definition of fluorescence anisotropy r polarisator I I I I filter/monochromator ^ y The anisotropy r reflects the rotational diffusion of a fluorescent species measured fluorescence emission intensity
Measurements of fluorescence anisotropy tomonitor binding of RNAP·s54 to different promoters q = 0.5 q = 0.5 Ptot = KD Ptot = KD Vogel, S., Schulz A. & Rippe, K.
Increasing complexity of binding all binding sites are equivalent and independent simple cooperativity heterogeneity all binding sites are equivalent and not independent all binding sites are independent but not equivalent difficult heterogeneity cooperativity all binding sites are not equivalent and not independent very difficult
Competitive Binding q = Ao/(Kd + Ao) but with a competitive “B” present, Kd = Kd,A (1 + [B]/Kd,B) replot apparent Kd to obtain Kd.B
Difference between microscopic andmacroscopic dissociation constant microscopic binding macroscopic binding Dfree kD kD 2 possibilities for the formation of DP DP 2 possibilities for the dissociation of DP2 kD kD DP2
The Monod-Wyman-Changeau (MWC)model for cooperative binding P P P P P P P P P P P P P P P P P P P P T0 T1 T2 T3 T4 +P T conformation (all binding sites are weak) +P +P +P kT kT kT kT L0 L1 L2 L3 L4 +P +P +P +P R conformation (all binding sites are strong) kR kR kR kR R0 R1 R2 R3 R4 • in the absence of ligand P the the T conformation is favored • the ligand affinity to the R form is higher, i. e. the dissociation constant kR< kT. • all subunits are present in the same confomation • binding of each ligand changes the T<->R equilibrium towards the R-Form
The Koshland-Nemethy-Filmer (KNF)model for cooperative binding P b-conformation (induced by ligand binding) a-conformation (facilitated binding) a-conformation +P +P P P k2 k1 +P k’2 P P • Binding of ligand P induces a conformation change in the subunit to which it binds from the a into the b-conformation (“induced fit”). • The bound ligand P facilitates the binding of P to a nearby subunit in the a-conformation (red), i. e. the dissociation constant k2 < k’2. • subunits can adopt a mixture of a-b confomations.
∆G, ∆Go of an reaction at equilibrium van’t Hoff Equation -DHoDSo lnK =+ RT R