Download
1 / 16
160 likes | 327 Vues
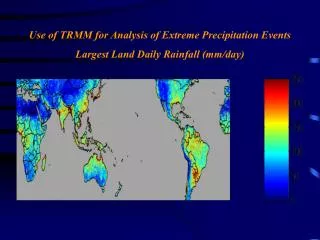
Use of TRMM for Analysis of Extreme Precipitation Events Largest Land Daily Rainfall (mm/day). Real-time Heavy Rain Maps (updated every 3 hours) 1 day (35 mm), 3 day (100 mm), 7 day accumulations (200 mm). 20 June 2007 06 GMT. Landslide Susceptibility Map. Topography. Morphology.

E N D
Use of TRMM for Analysis of Extreme Precipitation Events Largest Land Daily Rainfall (mm/day)
Real-time Heavy Rain Maps (updated every 3 hours) 1 day (35 mm), 3 day (100 mm), 7 day accumulations (200 mm) 20 June 2007 06 GMT
Landslide Susceptibility Map Topography Morphology DEM, Slope, Aspect Curvature, Concavity Soil Property Geology Hydrology Sand, Foam, Silt, Clay Lithological makeup e.g., Soil Moisture Land Cover Shrub, barren, urban Surface Controlling Factors Global landslide susceptibility map constructed using Shuttle Radar Topography Mission (SRTM) DEM, MODIS vegetation and soil characteristic information
Sea Surface Temperature Measurements from TRMM High-resolution SST measurements through clouds from TMI data provided early detection of the 1998 La Nina and instability waves (Wentz, Science 1999) High-resolution SST measurements illustrated the deleterious effect of Hurricane Bonnie’s cold wake on the development of Hurricane Danielle
Compelling New Looks at Hurricanes, Typhoons, and Cyclones TRMM has observed the inner structure of natural hazards like hurricanes Mitch (1998), Bonnie (1998), and Floyd (1999).
9/16/04 Surface Wind (km/h) (mph) Saffir/Simpson Category 5 4 3 2 1 Tropical Storm 248 209 180 151 118 61 156 130 112 94 74 38 9/14/04 9/12/04 9/15/04 9/10/04 9/08/04 Mosaic of TRMM overpasses of Hurricane Isabel (2004) crossing the Atlantic Hurricane Intensity
TRMM Impact on Mesoscale Simulation of Super Typhoon Paka Rain(mm/3hr), Sea-level Pressure & 850 hPa Wind 13 DEC 1997 0900UTC (IC: GEOS without TRMM) SSM/I 85 GHz Brightness Temperature, PAKA (8.9N, 161.8E) 13 DEC 1997 0911UTC Rain(mm/3hr), Sea-level Pressure & 850 hPa Wind 13 DEC 1997 0900UTC (IC: GEOS with TRMM) Zhao-Xia Pu and Wei-Kuo Tao
El Nino and La Nina Precipitation Anomaly Patterns Warm PacificCold Pacific La Nina El Nino Red: positive precipitation anomalies Blue: negative precipitation anomalies
NASA constellation (2014 launch) at 30-40o inclination GPM Core Spacecraft (2013 launch) at 65o inclination Global Precipitation Measurement (GPM) mission Megha-Tropiques NOAA-N’ NPP MetOp-B NPOESS-C1 GCOM-W
GPM Sensors Microwave radiometer (GMI) [U.S.] 10.7, 18.7, 23.8, 37, 89, 165, 183 GHz (dual polarized except for 23.8V-only) conical scanning at 4.5 km resolution at 89 GHz 800 km swath Dual frequency precipitation radar (DPR) [Japan] cross-track scanning at 5 km resolution Ku-band: 13.6 GHz, 245 km swath Ka-band: 36.55 GHz, 120 km swath
Unify and advance global precipitation measurements through Advanced microwave sensors & algorithms (dual-frequency radar & microwave imager) A consistent framework for inter-satellite calibration International science collaboration in algorithm development, ground validation Improved use of precipitation data in research & applications
GPM Core Satellite Increased sensitivity for light rain and snow detection Better overall measurement accuracy Detailed microphysical information and a common cloud database for rain & snow retrievals from Core & Constellation sensors NASA constellation Improved near-real time hurricane monitoring and prediction
What can GPM do? • To extend TRMM's observations of precipitation to higher latitudes, with more frequent sampling, and with focused research on providing a more complete understanding of the global hydrological cycle. • To be capable of measuring rain rates as small as a hundredth of an inch per hour to as large as 4 inches an hour. • To be able to estimate the various sizes of precipitation particles, and will also discriminate between snow and rain. • To achieve rainfall measurements with a 3-hour average revisit time over 80% of the globe, and the data will be available to users within 3 hours of observation time.
Thank you! San Jose State University


![Background [1] Sources of Precipitation Information](https://cdn3.slideserve.com/5700776/slide1-dt.jpg)