Unlocking Your Trading Potential: The Self Market System
Discover the Self Market System for trading success. Understand the core beliefs, strategies, and techniques to achieve your passion and purpose in the market. Learn about different trading systems and decision-making processes to grow and improve your trading. Stay aligned, get results, and find your sweet spot in the market.

Unlocking Your Trading Potential: The Self Market System
E N D
Presentation Transcript
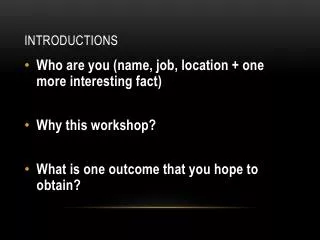
Introductions • Who you are • Where you’re from • What you trade • Why you are here • What you want • One fun thing
Finding Your Sweetspot Self Market System Self Market Stay aligned System Get aligned
Alignment in Action Self Market System Results Passion Purpose Beliefs Values Actions behavior thoughts feelings identity
Trading body of knowledge Long term investing • Blended Monthly Rebalancing • Monthly rebalancing • Quarterly rebalancing • Annual rebalancing Intraday trading • Frog (3) • RFA • RLCO • SQC Swing trading • Channeling • Overreaction • Triple screen • 551w • Washout • MaxPain Range Compression • Autoframing Core & turbo Core & turbo Techniques & concepts • Technical analysis • Statistics • Market classification • Position sizing • Trade framing • Core & Turbo • Green, Yellow, Red zones • Stalking and re-entry • Rangestat, slope stat, volstat • SQN and TQN Systems Strategies Techniques Tips
Material framework Techniques & Tips Market Core Swing Day Self (Psychology, learning style, objectives, skills, risk)
Overreaction Channeling Triple screen Washout 5DD Max Pain Growing the trade System A Monthly RB % 2-10 days System B System B Can be a screen or set-up for System A ! %
Bias Overconfidence, Optimism bias Hindsight bias Self-attribution Confirmation bias Knowledge illusion Illusion of Validity Illusion of control Illusory correlation Sample size Illusory trends & patterns Biased 2d hand knowledge Representativeness heuristic bias
The inside of my head is a busy place CEO Trading Cust Svc R&D Prototype Accting Benchmark Chief of Staff Staff Call Production System A System B1 System B2 System B3 System B4 System B4
Beliefs about SystemsA group of components organized to seek a goal in an environment Environment Input Process Output • Purpose (Objectives) • Whole > Sum of parts • Input-Process-Output • Interactive, Integrative, Iterative • Feedback loops and learning: Relationships • Reinforcing and counterbalancing • Boundaries and durations: Scope • Non-linear, dynamic relationships • Modeling and describing is learning • Hard, Soft, Evolutionary systems • The Map is not the territory, but it can help
Objectives Be careful what you ask for • Beat the market • Highest return within risk tolerance • Achieve required return at the lowest risk • Unit of return vs unit of risk • Longevity vs shortest time to achieve goal • Be small when wrong, large when right • Feel professional (BE PROFESSIONAL)
Monthly review questions What worked for my trading this past month? What did not work? What do the metrics tell me - in what instruments did I make money? In which did I lose? Is there a pattern? Did I keep to my exercise and meditation schedules? Was there a correlation between my trading and how I felt for that day? Did I monitor the Ebb & Flow position sizing or did I persist with too large or too small a size even after market conditions changed? What were my greatest challenges/lessons? Of what am I most proud? What do I most regret? What attitudes and actions will I take with me into the new month? What lessons have I learned this month? What limiting beliefs did I shift? What negative emotions did I shift? How did I grow, improve, and expand myself?
Oh! The Choices you’ll make! Time Frames Risks Objectives Trading systems Trading strategies Trading vehicles Risk management
What’s the nature of the market? Chaotic Complex Random Complicated Simple Description Dynamic? Process Strategy Process Value • Different situations need different responses, strategies, approaches • Boundaries, indicators, volatility? • What about the market? Open, (network) Dynamic Morphing Metaphorical Balance Sense-making Probabilistic Uncertain Statistical Analytical Calibration Discipline Closed, linear Static Rational Engineering Analysis Control (Closed), network Dynamic Systems Adaptive Modeling Learning Closed, linear Static Instinct Training Analysis Speed, precision
Performance Math Stock Sector Market 25% 25% 50%
Market Classification 1/6 2/3 1/6
Market classification strategy Notes: • SPY = mkt • 13 years, daily data • Bull vs Sideways vs Bear • Volatile vs Normal vs Quiet • Examine each axis • Combine into 3x3 matrix • Examine slope of 50d MA too • Very interesting results quiet normal volatile
Market condition • Volatile • Normal • Quiet • Bull • Sideways • Bear
Market condition • Volatile • Normal • Quiet ETF2 ETF C ETF O 5DD & 5DDC • Bull WO & WOC Triple Screen 551w screen 5DD & 5DDC WO & WOC • Sideways 551w screen 5DD & 5DDC & 5DDF WO & WOC & WO Failure • Bear ETF O Triple Screen
Sector Analysis The Morningstar Cube Value Blend Growth Large Medium Small
Efficiency of Hierarchy Top-Down Approach Equity Mkt Mkt Major Indices Dow S&P NAS Sectors Companies V B G L M S "Morningstar Cube"
Efficiency of Hierarchy Top-Down Approach Equity Mkt Mkt Major Indices Dow S&P NAS Sectors Companies Investor V B G L M S "Morningstar Cube" Management Lens/Filter (provided by fund managers)
World Market Model Value Blend Growth DIA SPY QQQ Large IJJ MDY IJK Mid IJS IJR IJT Small Liquid US Index ETFs: Can be shorted on a downtick
Stormy Weather Equities Beliefs Real Estate Business • Results • Losing Streaks • Experts • Advertising • Media • Self-doubt • Emotions • Success • Guilt
Traffic lighting with statistics +1 St Dev Average -1 StDev Adaptive Time period matters Current state Changing state Time series
Getting on the bandwagon 100% 50% 0% 5 1 4 2 Innovators Early adopters Early mass adopters Late mass adopters “Grumpy old men” 3 3 2 4 1 5
Example of Green & Yellow Zone Standard frame Profit target for the swing trade I want to be long in the swing trade position Green zone Mechanical entry for the swing trade I can try to front run a green zone trade if I can see to the one inside yesterdays range Yellow zone Initial stop for the swing trade I am out of the swing trade or I am going short, because it’s failing Red zone When the swing trade pattern fired
Green zone & Yellow zone trading Green Zone Trading: mechanical trading once Price moves above yesterday’s range • Use scans & systems to find high probability/high payoff swing trade candidates • Any of the Tortoise swing trade systems, patterns, preferences • Frame the trades that meet 2:1 reward:risk ratios on a re-test of the 10day High • Enter the trades when price > yesterday’s high +.05 • Initial risk: .05 below yesterday’s low (or 1x ATR if you prefer) • Once in the trade, use a trailing stop of the initial risk or adjust to .05 below yesterday’s low Think of the Green Zone as the Core position with overnight/Swing trade levels of risk
Green zone & Yellow zone trading Yellow Zone Trading: intraday opportunity trading on a mechanical trade, with tactical momentum • Start with any Green Zone trade frame that gives 2:1 • Look for opportunities when you can see 2:1 reward:risk, using the mechanical entry as your profit target • Tighten up your stop and prepare to take profits if it stalls near the mechanical entry • Consider adding another position at the mechanical entry, or simply accept the current trade as your mechanical Green Zone trade, but with an improved entry, and let it become your swing trade • If you have a successful Yellow Zone trade AND a Green Zone trade, take the Yellow Zone trade off before the close, so you only carry the swing trade risk overnight, then seek to get back in the following day with another Yellow Zone trade Think of the Yellow Zone as the “Turbo” position with intraday trade levels of risk
Green zone & Yellow zone trading How to think about trading the “Gap fail” tHOD Rangestat tLOD Any swing pattern can get us here 1 2 3 4 5 6
“I got 3% return, is that any good?”
Indexing • comparing a range of performance • comparing apples and oranges • "normalizes" data, helps trendspotting (x-min) 100 * (max-min) 3- (-5) 100* = 40 15- (-5) 3- (-12) 100* = 75 8- (-12)
ETF 2.0 summary Top Down analysis • Market Condition • ETFs • Regions Calculations • Strength • Consistency • Quality • Asset allocation Reports • Benchmarking • ETF "stars" • Regions • ETF swing trading Goals • Consistency • Discipline • Routine • Simplicity
ETF 2.0 = Average Quality Strength Consistency + + Strength: calculate RS (blended 3 & 6 month performance) 0-100 STR Consistency: indexed, 10 week weighted average of Relative Strength 0-100 CON Quality: indexed, 40 week “Quality rating” (Avg%Gain) / (StDev)0-100 QUAL Average: the average of STR + CON + QUAL 0-100 AVG
ETF 2.0 assessment (2005-2007) Ruleset observations • Outperforms SPY buy and hold • Outperforms SPY timed buy & sell • Timing adds value • Selection adds value • dB finds every trend, long and short, supports opportunity trading as well as weekly positioning • Exits • 10% stops are good for starting, but could be tightened on winners and in Bear markets • Strong argument for 3-4R winner as a Good Win to protect • Stronger argument for 5R winners as Exceptional win Avg loss: 5% 1R = 5%
ETF 2.0 assessment (adds 2008-2010) Avg loss: 5% 1R = 5% Ruleset observations • Outperforms SPY buy and hold, timed buy and sell • Timing, selection adds value • dB finds every trend, long and short, supports opportunity trading as well as weekly positioning • Replace Tortoise Index with 6 month RS (easier) • Max drawdown -8% in 2 bear markets (SPY -43%) • Exits • 10% stops are good for starting, but could be tightened on winners and in Bear markets • Strong argument for 3-4R winner as a Good Win to protect • Stronger argument for 5R winners as Exceptional win