Download
1 / 40
400 likes | 513 Vues
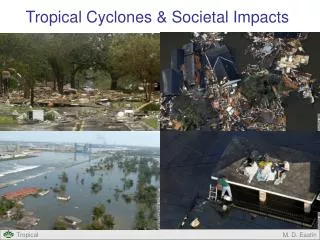
This outline provides a comprehensive overview of tropical cyclones (TCs) and their societal impacts, focusing on meteorological effects during landfall. It covers critical elements such as wind speeds categorized by the Saffir-Simpson Scale, storm surge dynamics, rainfall patterns, and predecessor rain events (PREs). The document also examines tornado occurrences, the extent of death and damage caused by TCs, and raises questions about human impacts on TC climatology. This information is essential for improving preparedness and mitigating risks associated with these powerful storms.

E N D
Tropical Cyclones & Societal Impacts M. D. Eastin
Outline • Meteorological Impacts Landfall • Winds and the Saffir-Simpson Scale • Storm Surge and Waves • Rainfall • Predecessor Rain Events (PREs) • Tornadoes • Death and Damage • Beyond Death and Damage • Are we affecting the TC climatology? M. D. Eastin
Winds and the Saffir-Simpson Scale • A Classification System for TCs • Developed by Herbert Saffir (civil engineer) • and Dr. Robert Simpson (NHC Director) • in 1971 as a means to convey expected • structural damage caused by a hurricane • with a given maximum wind speed • Initially designed to guide civil engineers in • the establishment of building codes. Thus, • damage estimates are for structures built • to code (Was your residence built to code?) • Modified versions of the Saffir-Simpson Scale • are used worldwide • NHC recently updated the scale with additional • information on potential damage to various • structures and infrastructure ** Herbert Saffir Dr. Robert Simpson M. D. Eastin
Saffir-Simpson Scale M. D. Eastin
Saffir-Simpson Scale • Category 1 • Maximum winds (74-95 mph; 64-82 knots) • No real damage to anchored structures. • Some damage to unanchored mobile • homes shrubs trees and signs. • Category 2 • Maximum winds (96-110 mph; 83-95 knots) • Some roof and window damage to anchored • structures. Considerable damage to trees • unanchored mobile homes, signs, and piers. • Category 3 • Maximum winds (111-130 mph; 96-113 knots) • Some structural damages to small structures. • Most trees and mobile homes destroyed. M. D. Eastin
Saffir-Simpson Scale • Category 4 • Maximum winds (131-155 mph; 114-135 knots) • Extensive damage to residential structures • Category 5 • Maximum winds (>156 mph; >135 knots) • Complete destruction of most structures M. D. Eastin
Storm Surge • Basic Concept: • Rise in sea level and onshore rush of water • caused by the “piling up” of water by the • strong winds and a small rise due to the • suction effect by the low pressure • Ranges from < 10 cm to > 10 m • Does not include waves • Significant threat to coastal structures • Primary Factors in Surge Height: • Maximum winds • Minimum surface pressure • Size of wind field • Storm speed • Coastline shape • Slope of the continental shelf • Tidal cycle Shallow Sloped Shelf Steep Sloped Shelf M. D. Eastin
Storm Surge • Forecasting Storm Surge: • SLOSH (Sea Lake and Overland • Surges from Hurricanes) Model • Run at NHC • Uses storm pressure, winds, • size, track, and forward • speed as predictors • Incorporates detailed ocean, • coastal, and river bathymetry • observations • Forecasts are accurate to • within 20% • Highly dependant on track SLOSH Model run for a hypothetical weak hurricane M. D. Eastin
Waves • Waves are Superimposed upon the Storm Surge: • Waves heights are greater at higher winds • Typical open-ocean wave heights are 5 to 15 meters (16-50 feet) • Maximum observed wave height 27.7 meters (97 feet) in Ivan (2004) • Significant threat to coastal structures and beaches Hurricane Bonnie (1998) Mean Wave Heights (m) at Landfall * * Hurricane Bonnie (1998) Mean Wave Heights (m) in the open ocean shown over the coastline Storm center From Walsh et al. (2002) M. D. Eastin
Impact of Storm Surge and Waves M. D. Eastin
Impact of Storm Surge and Waves Result of a 25 foot surge and 15-20 foot waves M. D. Eastin
Rainfall Rainfall vs. Intensity • The greatest threat during a TC landfall: • Significant in even weak TS • Spatial distribution is a function of: • Intensity • Forward Motion • Terrain • Vertical Wind Shear • Environmental Moisture • Forecasts: • Remains a difficult forecast challenge • Old Rule: 100 inches / Speed (knots) • Aided by NWS WSR-88D radar and • the TRMM precipitation radar Average Rainfall Entire TC Average Rainfall by Region Eyewall Rainbands From Cerveny et al. (2002) M. D. Eastin
Rainfall Along-Track Shear Cross-Track Shear Storm Motion and Shear Vectors Accumulated Rainfall Storm Motion and Shear Vectors Accumulated Rainfall From Rogers et al. (2003) M. D. Eastin
Rainfall Hugo at Landfall Intensity: 120 knots Motion: NW at 24 knots Shear: from the SE at 5 knots Danny at Landfall Intensity: 65 knots Motion: NE at 3 knots Shear: from the E at 5 knots M. D. Eastin
Rainfall Ivan at Landfall Intensity: 105 knots Motion: N at 12 knots Shear: from the SW at 7 knots Floyd at Landfall Intensity: 95 knots Motion: N at 23 knots Shear: from the SW at 20 knots M. D. Eastin
Rainfall Allison at Landfall Intensity: 50 knots Motion: N at 5 knots Shear: from the SW at 4 knots Dean at Landfall Intensity: 40 knots Motion: NW at 6 knots Shear: from the NE at 5 knots M. D. Eastin
Predecessor Rain Events (PREs) • Mesoscale region of heavy rainfall located ahead of an approaching TC • Can “prime” a region for extensive flooding by saturating the soil before • the TC-related rainfall arrives. TropicalStorm Erin (2007) From Galarneau et al. (2010) M. D. Eastin
Predecessor Rain Events (PREs) • Defining Criteria: • Radar dBZ > 35 within a coherent • mesoscale area for at least 6 hr • Area-average rain rate > 100 mm/day • Well-defined separation (~1000 km) • between the TC and PRE • Associated with a deep plume of • tropical moisture intersecting a • low-level baroclinic zone (or front) • beneath a jet entrance region Shading = Radar Reflectivity Wind barbs = 0-6 km Shear Contours = Surface Temperature Line = Surface Front Line = Upper-level Jet From Galarneau et al. (2010) M. D. Eastin
Predecessor Rain Events (PREs) • Common Characteristics: • PREs are located ahead of and • to the left of the TC track (LOT) • Upper-level jet is anticyclonically • curved (AC) • Moisture plume typically contains • Total Precipitable Water (TPW) • in excess of 50 mm • Notable PREs: • Frances 2004 (in NY) • Marco 1990 (in TN, NC, VA) • Agnes 1972 (in DC, MD, and PA) PRE Erin From Galarneau et al. (2010) M. D. Eastin
Predecessor Rain Events (PREs) From Galarneau et al. (2010) M. D. Eastin
Tornadoes • Basic Statistics: • Roughly 60% of landfalling TCs • have at least one tornado reported • Hurricane Beulah (1967) had 113 • tornadoes reported (the maximum) • Over 70% of tornadoes are located • in outer rainbands • Over 85% occur in the right-front • quadrant with respect to the storm • motion vector • Over 90% are F0-F2 on the Fujita • scale (max winds 32-90 m/s) • Roughly 60% of tornadoes occur • between 12-18 LST • Over 70% occur when the TC is • within 250 km of the coast Location of all Hurricane Tornadoes (1948-1986) Storm Motion From McCaul (1991) M. D. Eastin
Tornadoes • Relationship to CAPE and Low-Level Shear: • McCaul (1991) performed a census of 1296 soundings made within 3 hours • and 185 km of a reported hurricane tornado. • Hurricane tornadoes form in a low CAPE (~700 J/kg) but high vertical shear • (~10 m/s between 0-6 km altitude) environments • [For comparison] Great Plains tornadoes form in high CAPE (~2500 J/kg) and • high vertical shear (~12 m/s between 0-6 km) environments Hurricane Tornado Locations Mean CAPE Mean 0-6 km Shear From McCaul (1991) M. D. Eastin
Tornadoes • Physical Mechanism for Hurricane Tornado Genesis: • Proposed by Gentry (1983) • Increased low-level vertical shear • results from enhanced friction • as air flows onshore • Produces low-level horizontal • vorticity “tubes” • If these “tubes are tilted into the • vertical by an updraft/downdraft • couplet • Further convergence into the • updraft region could increase • the (now) vertical vorticity and • a tornado may forms Offshore Flow Onshore Flow 1 3 2 M. D. Eastin
Tornadoes • Radar Signature of Hurricane Tornado Cells • Tornado producing cells often exhibit • “hook echoes”, suggesting a link to • a mesovortex and the classic Great • Plains supercell structure • Hurricane supercells are often shallow • with a mesovortex confined below 3 km • WSR-88D radar and Forecasts: • Tornadoes are often associated small • cells with > 50 dBZ echoes and storm • relative rotational velocities of 6-15 m/s • that persist for 1-2 hours • The rotational features are often identifiable • up to 30 min prior to the tornado sighting Tornadic Cells Hurricane Ivan (2004) From Eastin and Link (2009) M. D. Eastin
Tornadoes New Research: Hurricane supercells can form well offshore Tornadic Cells in Hurricane Ivan (2004) Intense Convective Cells Dual Doppler Analysis Box (1804 UTC) From Eastin and Link (2009) M. D. Eastin
Tornadoes Dual-Doppler Analysis Z = 1.5 km Radar Reflectivity Cell-relative Winds Each cell exhibits an inflow notch or hook echo From Eastin and Link (2009) M. D. Eastin
Dual-Doppler Analysis Z = 1.5 km Radar Reflectivity Cell-relative Winds Updrafts > 2 m/s Vorticity > 2x10⁻³ s-1 Downdrafts < -2 m/s Vorticity < -2x10⁻³ s-1 Tornadoes Collocated updrafts and cyclonic vorticity indicative of supercells From Eastin and Link (2009) M. D. Eastin
Dual-Doppler Analysis Radar Reflectivity Cell-relative Winds Updrafts > 2 m/s Vorticity > 2x10⁻³ s-1 Downdrafts < -2 m/s Vorticity < -2x10⁻³ s-1 Tornadoes Shallow updrafts and vorticity indicative of mini-supercells From Eastin and Link (2009) M. D. Eastin
Death and Damage • Tropical cyclones are arguably the greatest natural threat to mankind: • Notable Tropical Cyclones of History: • Deaths Damage* • Bangladesh 1970 > 300,000 • Bangladesh 1991 > 138,000 > $1.5 billion • China 1922 > 50,000 • Hurricane Mitch 1998 ~11,000 > $1.0 billion • Typhoon Vera 1958 > 5,000 • Galveston Hurricane 1900 ~6000 • Hurricane Katrina 2005 ~2000 > $92.0 billion • Hurricane Sandy 2012 72 > $50.0 billion • Hurricane Andrew 1992 23 > $25.0 billion • * Value at time of occurrence • Comprehensive global statistics of death and damage for an “average” TC are unavailable. M. D. Eastin
Death and Damage • Death Statistics for the U.S. • Based on statistics from Rappaport (2000) for the period 1970-1999: • A total of 600 people died directly from tropical cyclones • Greatest loss of life was 125 in Hurricane Agnes (1972) • 59% Fresh-water flooding • 23% Drowning after leaving a vehicle • 12% Winds • 10% Offshore • 7% Surf / riptides • 4% Tornadoes • 1% Storm surge • 2% Other • Note: Over 2000 deaths occurred from Katrina 2005 alone M. D. Eastin
Death and Damage Damage Statistics for the U.S. All Natural Disasters (1960-2002) From Cutler and Emrich (2005) M. D. Eastin
Death and Damage • Damage Statistics for the U.S. • Based on statistics from Pielke and Landsea (1998) for the period 1925-1995: • All damages were normalized to 1995 dollars ($) based on changes in • coastal populations and changes in wealth (both have dramatically • increased in the past two decades) • Average annual impact of landfalling TCs is ~$4.8 billion • Over 83% of all damages are from Cat - 345 storms (21% of all TCs) • Costliest Tropical cyclones in US history: • 1. Katrina 2005 $76 billion • 2. SE FL-AL 1926 $72 billion • 3. Andrew 1992 $33 billion • 4. SW FL 1944 $17 billion • 5. New England 1938 $16 billion • 11. Sandy 2012 $11 billion (adjusted to 1995 dollars) • 12. Hugo 1989 $9 billion M. D. Eastin
Death and Damage • Damage Statistics: The Importance of Building Codes • Statistics are skewed due • to poor building codes • (or their non-compliance) • in coastal communities • Huge need for improvement! • Inexpensive – could save $4 in • damages for every $1 spent to • “hurricane-proof” a structure Galveston, Texas Hurricane Ike (2008) Home of a retired couple Their son is an architect and he made sure the house was built to code Evidently the others were not! M. D. Eastin
Beyond Death and Damage M. D. Eastin
Beyond Death and Damage Tropical Cyclone Impacts: International National Local Trade (port closures) Price of gasoline / heating oil Loss of basic utility services Stocks Markets Price of consumable goods ATMs inoperable Currency Values Cost of construction Cash registers inoperable Aid / Supplies Cost of insurance policies No credit card transactions Legislation No working gas pumps Government self-studies Perishable food spoils Loss of infrastructure No food deliveries Loss of civil order (police/fire) Limited medical services Schools destroyed Businesses destroyed Need for psychological services Need for social services M. D. Eastin
Our Affect on Tropical Cyclones • Is human activity changing the frequency or intensity of TCs? • One approach: Does the GFDL hurricane model produce more intense • tropical cyclones in a high-CO2 world? • From Knutson et al. (2001) • GFDL hurricane model: Limited area (global models provide BCs) • Employs three nested grids • Inner two grids follow the TC • Highest resolution is 1/6º (~18 km) • Coupled to the ocean • Complex bogus vortex scheme • Two Environments Control (Present day ocean-atmosphere) • High-CO2 (in 70-120 years with double CO2) M. D. Eastin
Our Affect on Tropical Cyclones • Knutson et al. (2001) • The High-CO2 ocean-atmosphere boundary conditions were obtained from the • mean conditions during forecast years 71-120 of a coupled simulation of the • GFDL global climate model using a +1% increase in CO2 per year as “forcing” • Forcing was based on observations and previous modeling efforts** • In the high-CO2 “world” tropical SSTs are ~2.5ºC warmer From Meehl et al. (2004) M. D. Eastin
Our Affect on Tropical Cyclones • Knutson et al. (2001) • Performed numerous simulations • in both environments with a spectrum • of bogus vortices incorporating random • perturbations to the maximum wind • Repeated the process in the six global • tropical cyclone basins • The net global mean result was a ~5% • increase in maximum intensity • Since the high-CO2 environment occurs • 70-120 years in the future, detecting • a trend in TC intensity due to global • warming would be nearly impossible From Knutson et al. (2001) M. D. Eastin
Tropical Cyclones & Societal Impacts • Summary: • Meteorological Impacts Landfall • Winds and the Saffir-Simpson Scale (origin) • Storm Surge and Waves (primary factors, forecasting) • Rainfall (primary factors, forecasting) • Tornadoes (statistics, environment, processes, forecasting) • Death and Damage (diversity and contributions to totals) • Beyond Death and Damage • Are we affecting the TC climatology? (current results) M. D. Eastin
References Eastin, M.D., and M. C. Link, 2009: Miniature supercells in an offshore outer rainband of Hurricane Ivan (2004), Mon. Wea. Rev., 137, 2081-2104. Galarneau, T. J., L. F. Bosart, and R. S. Schumacher, 2010: Predecessor rain events ahead for tropical cyclones. Mon. Wea. Rev., 138, 3272-3297. Gentry, R. C. , 1983: Genesis of tornadoes associated with hurricanes, Mon. Wea. Rev., 115, 1206-1223. Houston, S. H., and M. D. Powell, 1994: Observed and modeled wind and water-level response from Tropical Storm Marco (1990), Wea. Forecasting, 9, 427-439. Houston, S. H., W. A. Schaffer, M. D. Powell, and J. Chen, 1999: Comparisons of HRD and SLOSH surface wind fields in hurricanes: Implications for storm surge forecasting. Wea. Forecasting, 14, 671-686. Knutson, T. R., and Coauthors, 2001: Impact of CO2-induced warming on hurricane intensities as simulated in a hurricane model with ocean coupling. J. Climate, 14, 2458-2468. McCaul, E. W., Jr, 1991: Buoyancy and shear characteristics of hurricane-tornado environments. Mon. Wea. Rev., 119, 1954-1978. Pielke, R. A., Jr., and C. W. Landsea, 1998: Normalized hurricane damages in the United States: 1925-95. Wea. Forecasting, 13, 623-631. Rappaport, E. N., 2000: Loss of life in the united states associated with recent Atlantic tropical cyclones. Bull. Amer. Met. Soc.,81, 2065-2073. Rogers, R, S. Chen, J. Tenerelli, and H. Willoughby, 2003: A numerical study of the impact of vertical shear on the distribution of rainfall in Hurricane Bonnie (1998). Mon. Wea. Rev., 131, 1577-1599. Spratt, S. M., D. W. Sharp, P. Welsh, A. Sandrik, F. Alsheimer, and C. Paxton, 1997: A WSR-88D assessment of tropical cyclone outer rainband tornadoes. Wea. Forecasting, 13, 479-501. Walsh, E. J., and Coauthors, 2002: Hurricane directional wave spectrum spatial variation at landfall. J. Phys. Ocean., 32, 1667-1684. M. D. Eastin