WP1. GOAL
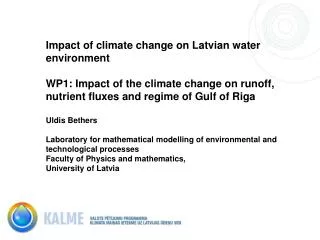
Impact of climate change on Latvian water environment WP1: Impact of the climate change on runoff, nutrient fluxes and regime of Gulf of Riga Uldis Bethers Laboratory for mathematical modelling of environmental and technological processes Faculty of Physics and mathematics, University of Latvia.

WP1. GOAL
E N D
Presentation Transcript
Impact of climate change on Latvian water environmentWP1: Impact of the climate change on runoff, nutrient fluxes and regime of Gulf of RigaUldis BethersLaboratory for mathematical modelling of environmental and technological processes Faculty of Physics and mathematics,University of Latvia
WP1. GOAL Modelling of several scenarious of the change of water environment using the existing climate change scenarious for Baltic Sea region WP1. TASKS WP1a. Evaluate and adapt the results from the regional climate models, and design the series of data which form the state of the water objects. Scenarios WP1b. Modeling of surface water and nutrients runoff for Latvia. Preparation of data series of river runoff for climate change scenarios Calculation of data series of nutrient runoff to the Gulf of Riga WP1c. Adapt 3D sea state models to produce the data series for the forecast of biogeochemical processes and sea ecosystem evolution. Oceanographic modelling WP1d. Provide modelling and data analysis support for other WPs. Support
Climate change scenarios (IPCC) Information flows Global circulation models Regional climate models River runoff scenarios Nutrient runoff scenarios Climate change scenarios adapted for Latvia Sea state scenarios (Gulf of Riga) Impact assessment (on Latvian water environment)
Climate scenarios 1A Methodics for measurement and comparison of RCM skill for control period 21 model (PRUDENCE) 118 observation stations and selected RCM mesh Daily meteorological data (temperature, precipitation, wind, humidity, cloudiness) Double downscaling: bias correction (statistical downscaling via histogram equalisation) of dynamically (via RCM) downscaled GCM data – T, p, r Histogram equalisation for moving time window [instead of daily or monthly or seasonal equalisation]
Daily data series for Latvia – contemporary climate, climate change scenarios
Insight : T-p diagram for Dobele, contemporary climate and A2 scenario Rainy, long autumn Pleasant Sep/Oct Winter only in Feb Summer 2 months longer, hot, dry Spring 2 weeks earlier
Noteces modelēšana 1B • Hidroloģisko modeļu ansambļa pieeja 2008 • Noteces kalibrācija / verifikācija ūdensobjektiem • Upju noteces scenāriji Atziņa 2008 – upju notece RJL sateces baseinā samazināsies vismaz par 5-10% • Reģionālā upju noteces izmaiņu analīze Latvijai 2009 • UBA noteces scenāriji 2009 • Biogēnu noteces scenāriji 2009 (paldies Bārbelei ) Atziņa – hidroloģiskā režīma daudzveidība Latvijā samazināsies NOVITĀTE PASAULĒ “Double ensemble forecast: ensemble of RCM vs. ensemble of hydrological models”
River runoff 1B Double ensemble approach Regional climate model River run-off Regional climate model Regional climate model Meteorological forcing Hydrological model (independent from RCM) Bias correction Hydrological model (independent from RCM) Modified meteorological forcing Hydrological model (independent from RCM)
Impact assessment by RCM ensemble (Bērze) Uncertainty prevails
Impact assessment by hydrological model ensemble Uncertainty remains but is decreased Decrease of both annual run-off and its maximum monthly value expected
Seasonal analysis by hydrological model ensemble Spring snow-melt flood significantly decreases Summer low flow period longer and better pronounced Autumn rainfall period extends into winter. Winter low flow disappears
Regional analysis (MIKE BASIN) W and N regions become similar to each other and contemporary E region C and E regions get closer
Nutrient run-off 1B* River run-off was calculated for control period and A2 scenario by MIKE BASIN hydrological model with daily time-step. Model was set-up for the drainage basin of the Gulf of Riga, dividing it into 42 subbasins. Yearly average nutrient loads are assumed to remain the same in the A2 scenario, while their seasonal distribution have been changed. Loads of Norg, N-NH4, N-NO3, Porg, P-PO4 with monthly time-step are used as the input for the nutrient model of the Gulf of Riga.
Sea state modeling 1C ORIGINAL PLAN – 3D climatic modeling failed Gulf of Riga: vertical temperature distribution General Ocean Turbulence Model (GOTM) Coefficients of second order model: Cheng (2002) Dynamic equation (k-ε style) for TKE Dynamic dissipation rate equation
Model forcing Climate data from PRUDENCE. Control: 1961-1990, Scenario A2: 2070-2100 Extra downscaling of RCM data (bias correction via histogram equalisation): relative humidity (used variable td2m) air temperature (used variable t2m) Original RCM data: sea level pressure (used variable MSLP) cloudiness (used variable clcov) wind speed (used variable w10m) wind direction (used variable w10dir) Calculations made for Gulf of Riga (50 m), 30 year period, daily output data – water temperature
Physical model results – I(mean temperature distribution over depth) Surface T increase close to air T increase T increase by 1,5 (bottom) to 3 (surface) degrees
Physical model results – II(mean daily pycnocline depth and its variation) ... stratification lasts longer Pycnocline develops earlier...
Physical model results – III(mean time-depth plots of temperature) Contemporary climate Climate change scanario A2