Download
1 / 20
200 likes | 334 Vues
This presentation by Nicola Eury explores the integration of Ecosystem Services (ES) into environmental damage restoration law. It discusses how an ES approach can respond to enforcement notices, optimizing mitigation, remediation, and restoration efforts. By evaluating remediation options through the lens of ES, stakeholders can ensure legal compliance while considering social, economic, and cultural factors. The presentation emphasizes the quantification of ecological service losses and gains from restoration efforts, aiming for effective recovery strategies post-environmental incidents, such as oil spills.

E N D
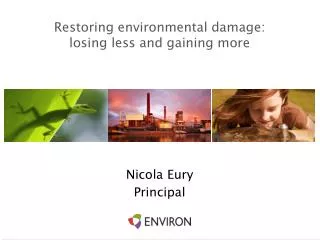
Restoring environmental damage: losing less and gaining more Nicola Eury Principal
Presentation content • Introduce Ecosystem Services (ES) concept • Explicit or implicit references to use of ES in damage restoration law • How to use an ES approach to respond to works/enforcement notices to optimise mitigation remediation and restoration
Ecosystem Services: “The Benefits people obtain from ecosystems”
Ecosystem Services Approach to dealing with Damage • ED Regulations 2009: remediation options must be evaluated using best available methods, and based on (amongst others) • the extent to which each option benefits each component of the natural resource or service • the extent to which each option takes account of relevant social, economic and cultural concerns and other relevant factors specific to the locality • Civil Sanctions Act 2008 • Restore the environment to the state that it would have been in before the offence • Where restoration is not possible, ensure equivalent benefit elsewhere
Calculating the loss relative to baseline baseline services A services lost % of Services Pollutant/ Contaminant Release Time to natural recovery to pre-release condition Primary Remediation Years
Area B - Services Provided (Benefit) B A Area A - Services Lost (Loss) Calculating the Gains from Restoration Options Impacts and benefits are based on changes from the baseline 20% B 0% Baseline Ecosystem Services -20% Environmental Economics-based Approaches Years
Case Example: Diesel fuel spill into river • Diesel spill into a river • River enters into large lake • River is poor quality with minimal recreational uses • Lake provides boating, swimming, aesthetic and other recreational value to the public.
Diesel Spill Recovery Curves Water Quality 100 80 60 40 20 0 Baseline Cumulative Percent (%) Recovery Note: Initial point of lost services will vary 0 1 2 3 4 5 Years
Diesel Spill Recovery Curves Water Quality Macroinvertebrates 100 80 60 40 20 0 Baseline Cumulative Percent (%) Recovery 0 1 2 3 4 5 Years
Diesel Spill Recovery Curves Water Quality Fish Macroinvertebrates 100 80 60 40 20 0 Baseline Cumulative Percent (%) Recovery 0 1 2 3 4 5 Years
Diesel Spill Recovery Curves Water Quality Macroinvertebrates Molluscs Fish 100 80 60 40 20 0 Baseline Cumulative Percent (%) Recovery 0 1 2 3 4 5 Years
Diesel Spill Recovery Curves 100 80 60 40 20 0 Baseline Cumulative Percent (%) Recovery 0 1 2 3 4 5 Years
Example: Impact to an Aquatic System For this Example: Parameter Evaluated: Fish Density (# fish/ha) 40% 20% 0% Baseline Services - 20% A - 40% Area A Represents the Loss of Ecological Services Over Time Units: Services per Hectare per Year: (SHY’s) Area A = -850 discounted SHY’s (loss over 5 years) (600 fish/ha = 40% Loss) - 60% - 80% (200 fish/ha = 80% loss) IMPACT - 100% 2009 2010 2011 2012 2013 2014 Years Quantifying Ecological Service Losses (1,000 fish/ha)
B Area B Represents the Gain of Ecological Services Over Time Units: Services per Hectare per Year: (SHY’s) Area B = 1,250 dSHY’s(gain over 25 years) 1,100 fish/ha (Gain = 10% ) 1,200 fish/ha (Gain = 20%) 1,000 fish/ha Restoration Implementation Quantifying Ecological Service Gains Example: In-Stream Restoration (e.g., physical in stream habitat modification) 40% 20% 0% Baseline (1,000 fish/ha) - 20% % of Services - 40% - 60% - 80% -100% 2009 2010 2011 2012 2013 2014 Years
Providing Human Use Services (additional credit) e.g., Creation of Bike Trail, Hiking Trail, Park B Baseline Services Full Maturity Start of Enhancement User Days Area B is calculated in units of user days generated Years
Summary • Civil sanctions directing polluters and their advisers to using an ES approach to damage valuation • An ES approach provides defensible propositions for restoration that are not necessarily the most costly option • These approaches are supported by DEFRA and the EA
Thank you Any Questions? Nicola Eury Principal, ENVIRON UK Limited +44(0)1392 440600 neury@uk.environcorp.com