Download
1 / 25
250 likes | 932 Vues
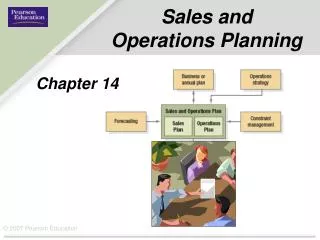
Sales and Operations Planning (Aggregate Planning). Sales and Operations Planning. Strategic and tactical considerations Top-down planning Bottom-up planning Optimization techniques. Back to Pennington Cabinet. Strategic Capacity Level: Five machines, nine assembly teams

E N D
Sales and Operations Planning • Strategic and tactical considerations • Top-down planning • Bottom-up planning • Optimization techniques ©2006 Pearson Prentice Hall — Introduction to Operations and Supply Chain Management — Bozarth & Handfield
Back to Pennington Cabinet • Strategic Capacity Level: Five machines, nine assembly teams • Company produces make-to-stock cabinets for sale at Lowe’s, etc. • Effective capacity: 5,000 jobs per year OR about 420 jobs per month ©2006 Pearson Prentice Hall — Introduction to Operations and Supply Chain Management — Bozarth & Handfield
Pennington (continued) Raw Demand for next 6 months: January 150 jobs February 250 March 350 April 450 May 600 June 650 What are our options . . . ? ©2006 Pearson Prentice Hall — Introduction to Operations and Supply Chain Management — Bozarth & Handfield
Pennington (again) . . . Raw Demand Need 450 600 Monthly capacity = 420 300 April ©2006 Pearson Prentice Hall — Introduction to Operations and Supply Chain Management — Bozarth & Handfield
Sales and Operations Planning (SOP) • Purpose: Select capacity options over the intermediate time horizon • Capacity options: • Workforces • Shifts • Overtime • Subcontracting • Inventories • etc. ©2006 Pearson Prentice Hall — Introduction to Operations and Supply Chain Management — Bozarth & Handfield
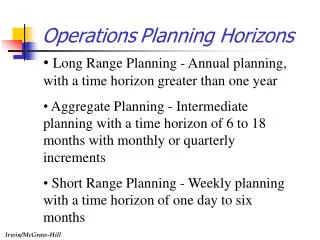
Time Horizon View . . . ©2006 Pearson Prentice Hall — Introduction to Operations and Supply Chain Management — Bozarth & Handfield
SOP continued (2 - 18 months out) • Outside of time frame strategic planning • Inside of time frame tactical planning “Big Picture” approach to planning • Families or groups (aggregation) of: • Products • Resources • Technologies or skills • Provide “rough” estimates ©2006 Pearson Prentice Hall — Introduction to Operations and Supply Chain Management — Bozarth & Handfield
Long-Range Plans SOP Short-Range Plans Position in the Overall Business Planning Cycle ©2006 Pearson Prentice Hall — Introduction to Operations and Supply Chain Management — Bozarth & Handfield
Inputs to the Process • Demand Management • Forecasts of customer demand • Need for spares, etc. • Pricing • Strategic Capacity Levels • Existing buildings • Processes SOPs • External Capacities • Suppliers • Subcontractors ©2006 Pearson Prentice Hall — Introduction to Operations and Supply Chain Management — Bozarth & Handfield
Advantages of SOP • Negotiated process • “Agreed” demand • Functional coordination • Budgets and cash flow analyses • Reduces operations task to “meeting the plan” ©2006 Pearson Prentice Hall — Introduction to Operations and Supply Chain Management — Bozarth & Handfield
Top-Down Similar products OR stable mix Standards available for planning time, cost requirements from history and/or planning documentation Can “Average” product Bottom-Up Different products AND unstable mix Requires forecasts and production data for individual products Can be extremely data-intensive SOP Approaches ©2006 Pearson Prentice Hall — Introduction to Operations and Supply Chain Management — Bozarth & Handfield
Top-Down Planning • Develop the aggregate sales forecast and planning values. • Translate the sales forecast into resource requirements. • Personnel, equipment, materials • Generate alternative production plans. • Chase, level, mixed • Select the best of the plans. • Lowest cost, best fit to capability ©2006 Pearson Prentice Hall — Introduction to Operations and Supply Chain Management — Bozarth & Handfield
Top-Down Example I(Product Data) ©2006 Pearson Prentice Hall — Introduction to Operations and Supply Chain Management — Bozarth & Handfield
Top-Down Example II(“Average” Products) 10%(40) + 60%(20) + 20%(15) + 10%(10) = 20 hours ©2006 Pearson Prentice Hall — Introduction to Operations and Supply Chain Management — Bozarth & Handfield
Top-Down Example III(Conditions or Constraints) • Agreed upon demand to be met for upcoming 12 month period • Can vary workforce and inventory levels • No backordering • “Average” unit requires 20 worker hours • Each worker works 160 hours per month ©2006 Pearson Prentice Hall — Introduction to Operations and Supply Chain Management — Bozarth & Handfield
Top-Down Example IV(Demand Forecast for 12 months) ©2006 Pearson Prentice Hall — Introduction to Operations and Supply Chain Management — Bozarth & Handfield
Top-Down Example V(Other tidbits of data …) • Hiring cost = $300 • Firing cost = $200 • Inventory holding cost = $6 / unit / month • Start and end with 227 workers (goal) • Start and end with about 1000 units in inventory (goal) ©2006 Pearson Prentice Hall — Introduction to Operations and Supply Chain Management — Bozarth & Handfield
Detail of First Six Months from Level Strategy Note: We develop a level strategy by setting “Actual Employees” equal to the average required for the 12 month planning period ©2006 Pearson Prentice Hall — Introduction to Operations and Supply Chain Management — Bozarth & Handfield
Detail of First Six Months from Chase Strategy Note: We develop a chase strategy by setting “Actual Employees” equal to the number needed in each period ©2006 Pearson Prentice Hall — Introduction to Operations and Supply Chain Management — Bozarth & Handfield
Another View ... ©2006 Pearson Prentice Hall — Introduction to Operations and Supply Chain Management — Bozarth & Handfield
Cost Details from theSpreadsheets ... Level strategy Chase strategy ©2006 Pearson Prentice Hall — Introduction to Operations and Supply Chain Management — Bozarth & Handfield
Top-Down Example(Other Issues …) • Are complete costs shown? • Expand out for budget and cash flow analysis • “Input” (suppliers) and “output” (logistics and warehousing) considerations • Lead time, materials availability, storage space? • Variations in actual production • Scrap, rework, equipment breakdowns ©2006 Pearson Prentice Hall — Introduction to Operations and Supply Chain Management — Bozarth & Handfield
Top-Down Example(Expand the options …) We can now subcontract production • Maximum subcontract of 1400 units per month • Cost is $5 more per unit than internal production cost • Will this option: • 1) increase costs? • 2) decrease costs? • 3) have no effect on costs? ©2006 Pearson Prentice Hall — Introduction to Operations and Supply Chain Management — Bozarth & Handfield
Second Approach:“Bottom-Up” SOP • Products with very different requirements • Requires forecasts and production data for individual products • Can be extremely data-intensive ©2006 Pearson Prentice Hall — Introduction to Operations and Supply Chain Management — Bozarth & Handfield