Download

1 / 12
120 likes | 765 Vues
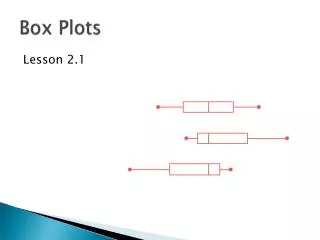
Box Plots (Box and Whiskers). Boxplot. A graph of a set of data obtained by drawing a horizontal line from the minimum to maximum values with quartiles labeled in between. It is a graphical plot of 5 specific values called the 5-number summary . 5-number summary….

E N D
Boxplot • A graph of a set of data obtained by drawing a horizontal line from the minimum to maximum values with quartiles labeled in between. • It is a graphical plot of 5 specific values called the 5-number summary.
5-number summary….. Minimum – lowest number in set Q1- middle number of the lower half Median – middle number of entire set Q3 – middle number of upper half Maximum – highest number in set
1. Find the 5-number summary. 2. Draw and label a scale of equal intervals. 3. Place dots above the 5 numbers 4. Put a box around Q1 and Q3. 5. Draw a vertical line through the median. 6. Draw “whiskers” from the minimum to Q1 and maximum to Q3. Steps……
Example…… • Draw a box plot of the following data. 33, 38, 43, 30, 29, 40, 51, 27, 42, 23, 31
Example…… • Draw a box plot of the following data. 59, 60, 65, 52, 51, 64, 71, 48, 40, 50
8, 10, 22, 24, 25, 25, 26, 27, 45, 72 • Graph & Describe
5, 7, 9, 9, 10, 11, 13, 17, 29 • Graph the Boxplot.
Comparative • Measure your longest finger. • Create boxplot of right vs left. • Describe
Assignment…… • Worksheet (Both sides).