Mastering Box Plots: Visualizing Data Sets with Statistical Measures
Learn different ways to graph data sets and study numerical measures for better data understanding. Explore box plots and statistical summaries.


Mastering Box Plots: Visualizing Data Sets with Statistical Measures
E N D
Presentation Transcript
Box Plots Lesson 2.1
In this chapter you will graph data sets in several different ways. You’ll also study some numerical measures that help you better understand what a data set tells you. • A good description of a data set includes not only a measure of central tendency, such as the mean, median, or mode, but the spread and distribution of the data as well. This is often done with a set of summary values or a graph.
Example A • Owen is a member of the student council and wants to present data about backpack safety to the school board. He collects these data on the weights of backpacks of 30 randomly chosen students. Owen wants to present a graph that shows the distribution and shape of the backpack data. Create a box plot of the data.
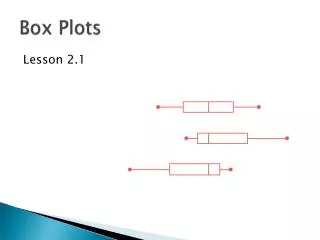
A box plot (or box-and-whisker plot) can be created from the five-number summary of the data.
Make a list of all the weights. 3, 4, 4, 4, 6, 7, 7, 7, 7, 7, 8, 8, 9, 9, 9, 9, 9, 10, 10, 10, 10, 10, 10, 13, 15, 15, 16, 17, 20, 33
Find the minimum, maximum, and median 3 9 33 3, 4, 4, 4, 6, 7, 7, 7, 7, 7, 8, 8, 9, 9, 9, 9, 9, 10, 10, 10, 10, 10, 10, 13, 15, 15, 16, 17, 20, 33 3, 4, 4, 4, 6, 7, 7, 7, 7, 7, 8, 8, 9, 9, 9, 9, 9, 10, 10, 10, 10, 10, 10, 13, 15, 15, 16, 17, 20, 33
Find quartile 1 and 3 3 9 7 33 10 3, 4, 4, 4, 6, 7, 7, 7, 7, 7, 8, 8, 9, 9, 9, 9, 9, 10, 10, 10, 10, 10, 10, 13, 15, 15, 16, 17, 20, 33 3, 4, 4, 4, 6, 7, 7, 7, 7, 7, 8, 8, 9, 9, 9, 9, 9, 10, 10, 10, 10, 10, 10, 13, 15, 15, 16, 17, 20, 33
Begin to make your Box and Whisker Plot 3 9 7 33 10 3, 4, 4, 4, 6, 7, 7, 7, 7, 7, 8, 8, 9, 9, 9, 9, 9, 10, 10, 10, 10, 10, 10, 13, 15, 15, 16, 17, 20, 33 3 33 28 7 8 9 10 13 18 23
The data set did not include every student in the school, so it may or may not tell much about all student backpack weights. If Owen took his sample from the first 30 students who arrived to a single class, then the data set might be biased, or unfair. It could represent students who hurry to class because their backpacks are too heavy. How might the information be biased if Owen took the sample from the first 30 volunteers? Assume that Owen’s data are from a simple random sample of the population. This means that every student is equally likely to be selected. This means that you can conclude that results for the sample data, such as a median of 9 lb, apply to all backpacks in the school.
The range is the difference between the maximum and the minimum. In this case the range is 33-3 or 30. The interquartile range (IQR), is the difference between the third quartile Q3 and the first quartile Q1 , or the length of the box in the box plot. In this case it is 10-7 or 3. The IQR is less affected than the range by extreme values in the data. Can you create two data sets with the same range where one has an IQR half as big as the other? {2, 3, 4, 5, 6, 7, 8, 9, 10} and {2, 5, 5, 5, 6, 7, 7, 7, 10} Both have range 8. The IQR for the first data set is 4; the IQR for the second data set is 2.
You can use a graph of data to look for clusters, gaps, and extreme values in the sample. One backpack in Owen’s sample weighed 33 lb, far more than the next largest weight of 20 lb. Would the sample be more representative of the population if that very heavy backpack were omitted?
Extreme values are called outliers when there is a gap between them and the rest of the data. A modified box plot can be used to show these gaps. In a modified box plot, any values that are more than 1.5 times the IQR from the ends of the box are plotted as separate points.
Example B • Use the backpack data from Example A to answer each question. a. Find the range and the interquartile range. b. Create a modified box plot showing the outliers. The range is equal to the maximum minus the minimum: 33-3=30 lb. The IQR is Q3-Q1 = 10 - 7 = 3 lb.
Decide on the largest and smallest value to be included on the whiskers. 3 9 7 33 10 3, 4, 4, 4, 6, 7, 7, 7, 7, 7, 8, 8, 9, 9, 9, 9, 9, 10, 10, 10, 10, 10, 10, 13, 15, 15, 16, 17, 20, 33 1.5 x IQR = 1.5 x 3 = 4.5 so nothing below 2.5 or greater than 14.5. The range is 3. Not 3 to 33. The IQR is 3. Not 7 to 10. 3 33 28 7 8 9 10 13 18 23
Statisticians often talk about the shape of a data set. The shape describes how the data are distributed relative to the center. A symmetric data set is balanced, or nearlybalanced, at the center. Skewed data are spread out more on one side of the center than on the other side. The backpack data provide an example of skewed data. For now, a box plot can be a good indicator of shape because the median is clearly visible as the center.
Pulse Rates Pulse rate is often used as a measure of whether or not a person is in good physical condition. In this investigation you will practice making box plots, compare box plots, and draw some conclusions about pulse rates.
What do you think a data set of all of our pulse rates would look like?”
“Do you think the pulse rates will be skewed left or right, or will they be symmetric?”
Step 1 • Measure and record your resting pulse for 15 seconds. • Multiply this value by 4 to get the number of beats per minute. • Pool data from the entire class.
Exercise for 2 min by doing jumping jacks or by running in place. • Afterward, measure and record your exercise pulse rate. Pool your data.
Step 3 • Order each set of data. • Calculate the five-number summaries for your class’s resting pulse rates and for your exercise pulse rates.
Step 4 • Prepare a box plot of the resting pulse rates and a box plot of the exercise pulse rates. • Determine a range suitable for displaying both of these graphs on a single axis.
Step 5 • Draw conclusions about pulse rates by comparing these two graphs. Be sure to compare not only centers but also spreads and shapes. • Could your conclusion apply to a larger population? • Describe the population and explain how your class is representative of that population.
Students should see • The range of resting pulse rates is less than the range of exercise pulse rates. • There was a percent increase in pulse rate from resting to exercise. • Using the medians of the sample data sets, students might say that one’s pulse rate should increase.
Answers about larger population will depend on your class. • If all students are the same age, but diverse in other characteristics, the class might be representative of a population of the same age. • If the class is heterogeneous in age, it might represent a sample of the school, but students might note that there are a smaller or larger percentage of athletes in the class than in the school, more or fewer girls or boys, and so forth.
the size of the sample • how well the sample represents the population • how well the conclusion applies to the sample If your sample is representative of a larger population, then the shape and spread of your sample data will be like the shape and spread of the entire population. In general you can draw conclusions about the population by describing the sample. What factors will influence how confident you are in your conclusions?