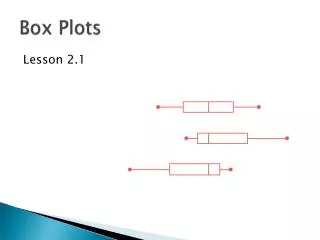
Box Plots
Box Plots. Mean ( x ):. Statistical Measures. Statistics practice of analyzing a set of data. Measures of Central Tendency : numbers that represent the middle of the data (mean, median, mode). Arithmetic average. Median:. Middle of the data listed in ascending order. Mode:.


Box Plots
E N D
Presentation Transcript
Mean ( x ): Statistical Measures Statistics practice of analyzing a set of data Measures of Central Tendency: numbers that represent the middle of the data (mean, median, mode) Arithmetic average Median: Middle of the data listed in ascending order Mode: Most common number (if modes – can be more than One) Skewed Right (positively): Less data to the right Skewed Left (negatively): Less data to the left
5 Number Summary: Min: Minimum Value (0 Percentile) Q1: Quartile 1 (25th Percentile) Med (Q2): Median (50th Percentile) Q3: Quartile 3 (75th Percentile) Max: Maximum or Q4 (100th Percentile) Min Med Max Q1 Q2 Q3 Q4
Test Scores Between what scores do the middle 50% lie? Between what scores does the lowest 25% lie? Which range of scores has more density? (more numbers in a smaller number) 4. What type of distribution does this have?
1) Which date has the most variability? 2) Make a statement about airline delays 3) Which would you expect to have larger variability (interquartile range) A) Heights of freshmen B) Ages of freshmen C) Weights of freshmen D) Heights of 5 year-olds?
Calculator Commands • Enter data into STATEDIT • STAT → CALC → 1: 1-Var STATS • → represents mean • n = no. of entries • med = median • Etc…
Mode: Most often number. Mean: Average. Median: The middle number when arranged from smallest to largest. Best to show when there are outliers!!! 1) Find the mode, mean, and median: 5,7,9,9,30 2) Which is the largest? 3) Now include a 90 in the data. Which of the three changed the most? 4) Now include a 90 in the data. Which of the three changed the most? 5) When they list salaries, why do they state the median price and not the mean price?
Ex. Find the mean, median, and mode of 85, 76, 88, 91, 85, 58, 88, 91, 97, 91, 88, 97, 97 • Mean ( ) = median = , mode = Draw a box plot of the data.
Deeper Understanding • Suppose there are 20 tests and the scores are all an 80%. What would change if 2 more tests were added that were both a 90%, mean or median? • What if there were 20 tests, 4 were 70%, 12 were 80%, and 4 were 90%. Three more tests were added to group scoring 70%, 90%, and 100%. How would the mean or median change?
Trick or Treat • Ten neighborhood kids went out to get candy. Here is a list of the number of treats they received: 45, 34, 56, 32, 10, 32, 62, 11, 55, 34 • Find the mean, median, and IQR of the treats. • The kid who got 62 treats, went back out and got 262 treats. Find the new mean, median and IQR. • Which does a better job of describing the typical number of treats for the new data? Why? • Draw a box plot.
Which way is the data skewed? Suppose you wanted to open restaurants. Where would you put a few of them? Where would you want a lot of them?