Download
1 / 24
240 likes | 397 Vues
Ecological forecasting in the intertidal zone: from MODIS to mussels. Brian Helmuth, David Wethey, Venkat Lakshmi, Jerry Hilbish, Allison Smith, Lauren Szathmary, Christel Purvis University of South Carolina, Columbia. Intertidal zone is an interface between marine and terrestrial ecosystems.

E N D
Ecological forecasting in the intertidal zone: from MODIS to mussels Brian Helmuth, David Wethey, Venkat Lakshmi, Jerry Hilbish, Allison Smith, Lauren Szathmary, Christel Purvis University of South Carolina, Columbia
Intertidal zone is an interface between marine and terrestrial ecosystems
Recent worldwide observations of intertidal mortality linked to climate Dead mussels New Zealand Bleached algae Necrotic tissue Photo: Laura Petes Washington Oregon
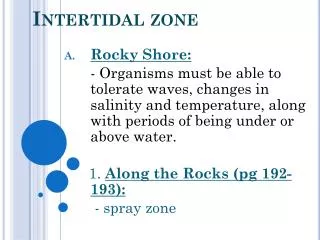
Potential causes of mortality, range shifts, and loss of biodiversity • Direct physiological effects (acute and chronic) • Changes in aerial body temperature • Changes in water temperature • Indirect effects • Competition • Predation • Factors not related to climate (e.g., anthropogenic influences)
Ecological niche modeling • Fundamental vs. realized niche space • Not all species range edges are set by climate • Should not expect to see impacts of climate change everywhere • Climate change may impact organisms in the middle of their ranges • Organism performance changes spatially and temporally include physiological data in niche modeling
Theoretical Models of Organism Body Temperature Climate and Remote Sensing Data Physiological and Ecological Data Determine Realized Niche Space Make Hypotheses Experimentally Test Hypotheses in the Field and Laboratory
Goals • How do we make predictions about geographic range boundaries? • Poleward migrations • Mosaic patterns • Where and when do we look for the current and future effects of climate change on ecological patterns? • Biodiversity • Abundance • Mortality • How do we mitigate these effects?
Two organisms exposed to identical microclimates can experience different body temperatures Seastar at ~12°C Mussel at ~21°C See details on Szathmary et al. poster…
Thermal mosaic over a large geographic range Shady Cove Cattle Point Tatoosh Boiler Bay Strawberry Hill Monterey Piedras Blancas Cambria Lompoc Landing Jalama Alegria Boat House Coal Oil Pt (Helmuth et al. 2006 Ecol Monogr)
Complex patterns are likely to occur worldwide due to tidal regimes Topex-Poseidon R/S Data for Tidal Height
How do we measure animal temperature over large scales in physiologically meaningful ways? Avg Max Mussel Temp Critical Physiological Temp Avg Mussel Temp Avg MODIS Temp See Purvis poster for more details…
Quantifying effects of climate over a cascade of scales http://uae2.gsfc.nasa.gov/terra_sat.gif Weather station data Remote sensing data In situ animal temperature data Wide spatial coverage Broad temporal coverage Noninvasive High spatial resolution More field intensive Directly relevant to animals
Thermal engineering model of animal temp. (“Inside out/Outside in”) Qrad, sky Qsolar Qconvection Qevaporation Wind Qrad, ground Qconduction Tair Qstored m, cp Tbody Twater Tground
NASA/NOAA data used as inputs to thermal engineering models NCEP= National Centers for Environmental Prediction; NARR = North American Regional Reanalysis; incorporates NASA R/S Data and NOAA ground-based data as part of reanalysis
Model Performance vs. Field Data -5 -4 -3 -2 -1 0 +1 +2 +3 +4 +5 too cold too hot Difference in Monthly Average Maximum (Gilman et al., PNAS 2006)
Model Performance vs. Field Data -5 -4 -3 -2 -1 0 +1 +2 +3 +4 +5 too cold too hot Difference in Monthly Average Maximum (Gilman et al., PNAS 2006)
Air Temperature vs. Field Data -5 -4 -3 -2 -1 0 +1 +2 +3 +4 +5 too cold too hot Difference in Monthly Average Maximum (Gilman et al., PNAS 2006)
Hypothesis testing • Produce short-range (8-day) forecasts and test using physiological measurements of stress (hsps, etc.) • Generate hindcasts of body temperature back to 1950’s using historical data: compare against biogeographic data • Make long-range predictions using GCM models: predict shifts in biodiversity/ ranges
Ecological forecasting 8-day forecasted mussel temperatures in upper intertidal from July 23, 2006 http://tbone.biol.sc.edu/forecasting
Patterns of mortality match forecasting predictions??? Photo: Laura Petes
Biogeography of Barnacles in Europe Physiological Information:Semibalanus balanoides have reproductive failure if SST > 10°C in winter Remote Sensing Information:10°C winter isotherm moved north between 1984 and 1998 Prediction:S. balanoides southern biogeographic limit moved north to the winter 10°C isotherm
Arrows indicate the southern limit of S. balanoides based on field surveys from Southern Portugal to Denmark in 1984 and 2005 February 1984 February 1998 Sea Surface Temperature (AVHRR 36km)
Remote Sensing • MODIS, ASTER Land Surface Temperature • MODIS Sea Surface Temperature • Climate Measurements • Skin vs. Modeled Temp • R/Sing Climatic Inputs • Skin vs. Body Temp • GPS Positioning • Thermal Engineering Models • Wave Run-up Models • Tide Cycles • Predator/Prey Studies • Population Genetics • Physiological Tolerances • In situvs. Modeled Temp In Situ & Laboratory Research Ecological Modeling
Acknowledgments • Woody Turner and the NASA Ecological Forecasting Team • NASA grant NNG04GE43G • Nova Mieszkowska, Sierra Jones, Karly Jones, Sarah Gilman, Srinivas Chintala • Bernardo Broitman, Carol Blanchette and Packard-PISCO (U.S. West Coast) • Steve Hawkins, Alan Southward and MARCLIM (Marine Biological Association, Plymouth, U.K.) • Cliff Cunningham and CORONA