Number of Primary Vertices
90 likes | 214 Vues
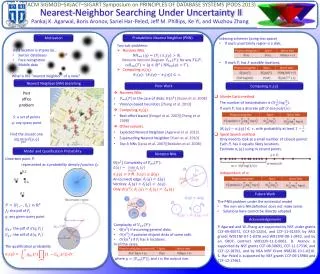
This report presents a detailed analysis of primary vertex events from high-energy physics experiments conducted in runs 97, 76, and 72. It highlights that 78.9% of events featured a single primary vertex, with similar figures for "beam-beam" (81.6%) and "beam-pipe" (71.6%) events. Additional findings include the distribution of secondary and tertiary vertices, focusing on their xy locations and average pseudorapidity (η) values for events with varying radius conditions. Data collected enhances our understanding of vertex dynamics in high-energy collisions.

Number of Primary Vertices
E N D
Presentation Transcript
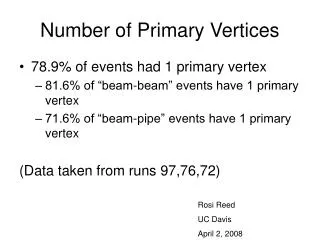
Number of Primary Vertices • 78.9% of events had 1 primary vertex • 81.6% of “beam-beam” events have 1 primary vertex • 71.6% of “beam-pipe” events have 1 primary vertex (Data taken from runs 97,76,72) Rosi Reed UC Davis April 2, 2008
Number of primary vertices Run 97, 76, 72
Number of primary vertices“Beam-Beam” events Run 97, 76, 72
Number of primary vertices“Beam-Pipe” events Run 97, 76, 72
xy Location of Second Vertex for Events with Vertex 1 r > 2 cm Run 97, 76, 72
xy Location of Third Vertex for Events with Vertex 1 r > 2 cm Run 97, 76, 72
Average Eta per Event for Events with Vertex 1 r < 2 cm Run 97, 76, 72 Eta averaged over primary tracks only
Average Eta per Event for Events with Vertex 1 r > 2 cm and |Vz| < 75 cm Run 97, 76, 72 Eta averaged over primary tracks only
Average Eta per Event for Events with Vertex 1 r > 2 cm and |Vz| < 75 cm Run 97, 76, 72 Eta averaged over primary tracks only