Download
1 / 28
280 likes | 417 Vues
Evaluating the impact of recent changes in isoprene and anthropogenic emissions on surface ozone over the eastern United States. Arlene M. Fiore. National Center for Atmospheric Research October 27, 2004. Acknowledgments. Larry Horowitz Chip Levy. Drew Purves Steve Pacala. Mat Evans

E N D
Evaluating the impact of recent changes in isoprene and anthropogenic emissions on surface ozone over the eastern United States Arlene M. Fiore National Center for Atmospheric Research October 27, 2004
Acknowledgments Larry Horowitz Chip Levy Drew Purves Steve Pacala Mat Evans Qinbin Li Bob Yantosca Yuxuan Wang
Isoprene Emissions are generally thought to contribute to O3 production over the eastern United States [e.g.Trainer et al., 1987; NRC 1991] + NOx O3 ISOPRENE PAR TEMP Leaf Area Vegetation changes Impact on O3?
Isoprene can also decrease surface O3 by: • Sequestering NOx as organic isoprene nitrates • Titrating OH and enabling direct reaction of isoprene with O3 High-NOx NO2 O3 NO ? (very fast) Isoprene nitrates RO2 OH Isoprene HO2 ? ROOH OH O3 O3 (slower ) Low-NOx, high-isoprene Isoprene emissions uncertain; New evidence for recent changes over E. U.S.
Purves et al. [2004]: observation-based BVOC emission estimates for mid-1980s and mid-1990s Forest Inventory Analysis • Estimate emissions from: • 2.7 million trees • species-specific emission capacities • canopy model (FIA data for depth & LAI) • f(T,PAR,LAI) [Guenther et al., 1993] • Aggregate results to 1°x1° • Changes from mid-1980s to mid-1990s? 280,000 Re- surveyed plots Adapted from D. Purves
Sweetgum Invasion of Pine plantations -20 –10 0 +10 +20 +30 Percent Change mid-1980s to mid-1990s Recent Changes in Biogenic VOC Emissions [Purves et al., Global Change Biology, 2004] Substantial isoprene increases in southeastern USA largely driven by human land-use decisions Land-use changes not presently considered in CTMs Isoprene Monoterpenes Trends in anthropogenic precursors?
-20 –10 0 +10 +20 +30 Percent Change Trends in Anthropogenic Emissions: 1985 to 1995 from US EPA national emissions inventory database(http://www.epa.gov/air/data/neidb.html) VOC NOx CO • Large decreases in CO and VOC Emissions • Some local increases in NOx • Higher biogenic VOCs Net effect On O3?
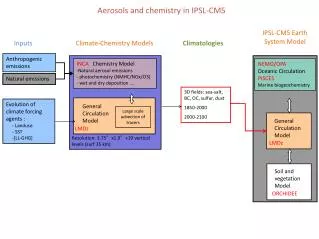
Approach: Insights from two chemical transport models GEOS-CHEM MOZART-2 • Quantify O3 response to • reported biogenic and • anthropogenic emissions • changes 1. Test whether results are model-dependent 2. Determine sensitivity to uncertainties in isoprene- NOx-O3 chemistry 2. Determine sensitivity to uncertainties in isoprene emissions O3 NO2 NO July mean isoprene emissions Isoprene nitrates OH Isoprene RO2 HO2 ROOH GEIA Purves (1011 molecules isoprene cm-2 s-1)
Tool #1: GEOS-CHEM tropospheric chemistry model [Bey et al., 2001] • Uses assimilated meteorology: GEOS-3 1°x1° fields for 2001 • 48 vertical levels ( 9 below 2 km) • Regridded to 4°x5° for global spinup and boundary conditions for nested 1°x1° over North America [Wang et al., 2004; Li et al., 2004] • 31 tracers; NOx-CO-hydrocarbon-O3 chemistry coupled to aerosols • GEIA isoprene emission algorithms [Guenther et al., 1995] • v. 5-07-08 (http://www-as.harvard.edu/chemistry/trop/geos/index.html) July 2001 1-5 p.m. Surface O3 (ppbv)
GEOS-CHEM Evaluation: July 2001 1-5 p.m. Surface O3 (ppbv) Mean Bias = 6±7 ppbv; r2 = 0.40
-20 –10 0 +10 +20 +30 (%) Isoprene increases reduce O3 in Southeastern US GEOS-CHEM July 1-5 p.m. O3 Change in July 1-5 p.m. surface O3 + Isoprene emission changes from mid-80s to mid-90s [Purves et al., 2004] ppbv Low-NOx regime? e.g. titration of boundary-layer OH in pre-industrial [Mickley et al., 2001]; and present-day tropical regions [von Kuhlmann et al., 2004]
IncreasingIsoprene Decreases O3 in Low-NOx, High-isoprene regions GEOS-CHEM base-case July 1-5 p.m. mean NOx- saturated Ozone NOx- sensitive Low-NOx High-NOx “isoprene-saturated”?? NOx VOC SE US is near “maximum VOC capacity point”, beyond which VOCs suppress O3 formation [Kang et al., 2003]. “Isoprene-saturated” GEIA SE US: biogenics+O3 (10d) comparable to O3+HOx (16d), O3+hn -> OH (11d) ISOP
July Anthrop. NOx emissions 0.43 Tg N (1011 molec cm-2 s-1) Difference in July 1-5 p.m. surface O3 (Purves–GEIA) (ppbv) Choice of isoprene inventory critical for predicting base-case O3 GEIA: global inventory 5.6 Tg C July isoprene emissions Purves et al., [2004] (based on FIA data; similar to BEIS-2) High-NOx regime 2.8 Tg C “isoprene- saturated” GEIA (1011 molecules isoprene cm-2 s-1)
Identify O3 chemistry regime with precursor emissions reductions Change in July O3 (ppbv; 1-5 p.m.) Isoprene reduced 25% NOx reduced 25% July Anthropogenic NOx Emissions With GEIA (1011 molec cm-2 s-1) ° Choice of isoprene inventory also critical for predicting O3 response to changes in isoprene and anthropogenic NOx emissions With Purves Low-NOx, high isop: O3 as isop High-NOx: O3 as isop highly NOx-sensitive
Change in Mean July Surface O3 (ppbv; 1-5 p.m.) reflecting 1980s to 1990s emissions changes With Anthrop. Changes With Anthrop.+ BVOC Changes With BVOC Changes With GEIA Isoprene Emis With Purves et al. Isoprene Emis Changes in Anthropogenic NOx emissions dominate O3 response But response depends upon choice of isoprene emission inventory Comparison with observed changes? Impact on high-O3 events?
Model vs. Obs.: Change in July O3 1980s to 1990s (ppbv; 1-5 p.m.) Obs: EPA AIRS GEOS-CHEM: GEIA GEOS-CHEM: Purves (1993-1997) – (1983-1987) Poor correlation (r2 ~ 0) between observed and simulated changes Observed changes in O3 are not explained by regional emission changes alone…
GEIA Purves Northeast Southeast Impact of Sensitivity Simulations on High-O3 Events: • decrease with isoprene except for GEIA SE • decrease with NOx, larger response with GEIA • dominated by anthrop. (NOx) emissions but BVOC changes may offset for most extreme events Unclear whether recent BVOC emission changes mitigated/exacerbated high-O3 events
Tool #2: MOZART-2 tropospheric chemistry model [Horowitz et al., 2003] • Uses assimilated meteorology: NCEP T62 (~1.9°) 2001 • 28 vertical levels (8 below 2 km) • 75 tracers; NOx-CO-hydrocarbon-O3 chemistry coupled to BC, sulfate, nitrate aerosols • GEIA isoprene inventory [Guenther et al., 1995] implemented as monthly mean emission with diurnal cycle July 2001 1-5 p.m. Surface O3 (ppbv)
MOZART-2 Evaluation: July 2001 1-5 p.m. Surface O3 (ppbv) Mean Bias = 24±10 ppbv; r2 = 0.50
-20 –10 0 +10 +20 +30 (%) Does MOZART-2 also predict decreases in O3 resulting from increases in isoprene emissions? MOZART-2: Change in July 1-5 p.m. surface O3 (ppbv) Isoprene emission changes from mid-80s to mid-90s [Purves et al., 2004] O3 increases (1-2 ppbv) Little change (NOx-sensitive) What if we assume isoprene nitrates are a NOx sink?
Chemical uncertainty: MOZART-2 shows similar results to GEOS-CHEM if isoprene nitrates are a NOx sink Change in July 1-5 p.m. surface O3 (ppbv) (due to isop emis changes from mid-1980s to mid-1990s) With 12% yield of isoprene nitrates GEOS-CHEM: GEIA GEOS-CHEM: Purves MOZART-2: GEIA ppbv Understanding fate of isop. nitrates essential for predicting sign of response to changes in isoprene emissions
What is the O3 sensitivity to the uncertain fate of organic nitrates and peroxides? High-NOx NO2 O3 NO ? (very fast) Isoprene nitrates RO2 OH Isoprene HO2 ? ROOH OH O3 O3 (slower ) Low-NOx, high-isoprene Sinks of HOx / NOx vs. recycling of radicals?
Impact on surface O3 from uncertainties in chemical fate of organic isoprene nitrates and peroxides Change in July mean 1-5 p.m. surface O3 (MOZART-2) ppbv When isoprene nitrates act as a NOx sink When organic peroxides act as a HOx sink Revisit MOZART-2 vs. observations…
Isoprene nitrates as a NOx sink better MOZART-2 O3 vs. observations 8% yield: bias = 20±10 ppbv; r2=0.46 12% yield: bias = 18±10 ppbv; r2=0.44
Using GEOS-CHEM NOx emissions in MOZART-2… bias = 20±7 ppbv; r2=0.64 With organic nitrates as NOx sink: bias = 16±7 ppbv; r2=0.61
Conclusions… and Remaining Challenges • Better constrained isoprene emissions are needed to quantify: • isoprene contribution to E. U.S. surface O3 • how O3 responds to both anthrop. and biogenic emission changes • satellite CH2O columns? • New inventories (MEGAN, BEIS-3) more accurate? • ICARTT observations?
Potential for ICARTT data over the Southeast U.S. to help determine which isoprene inventory is closer to reality? Vertical slices through 34N in GEOS-CHEM: Differences in surface & upper trop ISOP, CH2O, PAN, NOx With PURVES Altitude With GEIA Longitude 0 0.1 .25 0.5 1. 5. .1 .2 .5 1. 3. 5. 0 0.1 .25 0.5 0.8 1.0 0. .05 0.1 0.2 0.5 2.
Conclusions and Remaining Challenges • Better constrained isoprene emissions are needed to quantify: • isoprene contribution to E. U.S. surface O3 • how O3 responds to both anthrop. and biogenic emission changes • Utility of satellite CH2O columns? • New inventories (MEGAN, BEIS-3) more accurate? • ICARTT observations? • Recent isoprene increases may have reduced surface O3 in the SE • Does this regime actually exist? • Fate of organic nitrates produced during isoprene oxidation? • Results consistent in MOZART-2 and GEOS-CHEM • Reported regional emission changes from 1980s to 1990s alone do not explain observed O3 trends • Are anthropogenic emissions inventories sufficient to support trend studies? (Parrish et al., JGR 2002: inconsistencies with CO:NOx ratios from road traffic in EPA inventories vs. ambient msmts) • Decadal shifts in meteorology? Changing global O3 background?