
Exploring Edge Detection Techniques and Models for Image Analysis
E N D
Presentation Transcript
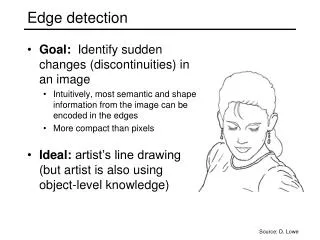
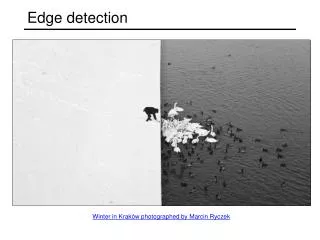
Edge detection • Edge detection is the process of finding meaningful transitions in an image. • The points where sharp changes in the brightness occur typically form the border between different objects or scene parts. • Further processing of edges into lines, curves and circular arcs result in useful features for matching and recognition. • Initial stages of mammalian vision systems also involve detection of edges and local features. 2019
Edge detection • Sharp changes in the image brightness occur at: • Object boundaries • A light object may lie on a dark background or a dark object may lie on a light background. • Reflectance changes • May have quite differentcharacteristics – zebrashave stripes, and leopardshave spots. • Cast shadows • Sharp changes in surfaceorientation 2019
Edge models 2019
Difference operators for 2D Adapted from Gonzales and Woods 2019
Difference operators under noise Solution is to smooth first: Adapted from Steve Seitz 2019
Difference operators under noise Differentiation property of convolution: Adapted from Steve Seitz 2019
Difference operators under noise Consider: Laplacian of Gaussian operator Adapted from Steve Seitz 2019
Laplacian of Gaussian Edge detection filters for 2D Gaussian derivative of Gaussian Adapted from Steve Seitz, U of Washington 2019
Difference operators for 2D sigma=4 Laplacian of Gaussianzero crossings Threshold=4 Threshold=1 sigma=2 Adapted from David Forsyth, UC Berkeley 2019
Edge detection • Three fundamental steps in edge detection: • Image smoothing: to reduce the effects of noise. • Detection of edge points: to find all image points that are potential candidates to become edge points. • Edge localization: to select from the candidate edge points only the points that are true members of an edge. 2019
Canny edge detector • Smooth the image with a Gaussian filter with spread σ. • Compute gradient magnitude and direction at each pixel of the smoothed image. • Zero out any pixel response less than or equal to the two neighboring pixels on either side of it, along the direction of the gradient (non-maxima suppression). • Track high-magnitude contours using thresholding (hysteresis thresholding). • Keep only pixels along these contours, so weak little segments go away. 2019
Canny edge detector Original image (Lena) Adapted from Steve Seitz, U of Washington 2019
Canny edge detector Magnitude of the gradient Adapted from Steve Seitz, U of Washington 2019
Canny edge detector Thresholding Adapted from Steve Seitz, U of Washington 2019
Canny edge detector How to turn these thick regions of the gradient into curves? Adapted from Steve Seitz, U of Washington 2019
Non-maxima suppression: Check if pixel is local maximum along gradient direction. Select single max across width of the edge. Requires checking interpolated pixels p and r. This operation can be used with any edge operator when thin boundaries are wanted. Canny edge detector 2019
Canny edge detector Problem: pixels along this edge did not survive the thresholding Adapted from Steve Seitz, U of Washington 2019
Canny edge detector • Hysteresis thresholding: • Use a high threshold to start edge curves, and a low threshold to continue them. 2019
Canny edge detector Adapted from Martial Hebert, CMU 2019
Canny edge detector 2019
Canny edge detector 2019
Canny edge detector • The Canny operator gives single-pixel-wide images with good continuation between adjacent pixels. • It is the most widely used edge operator today; no one has done better since it came out in the late 80s. Many implementations are available. • It is very sensitive to its parameters, which need to be adjusted for different application domains. 2019
Edge linking • Hough transform • Finding line segments • Finding circles • Model fitting • Fitting line segments • Fitting ellipses • Edge tracking 2019
Fitting: main idea • Choose a parametric model to represent a set of features • Membership criterion is not local • Cannot tell whether a point belongs to a given model just by looking at that point • Three main questions: • What model represents this set of features best? • Which of several model instances gets which feature? • How many model instances are there? • Computational complexity is important • It is infeasible to examine every possible set of parameters and every possible combination of features Adapted from Kristen Grauman 2019
Example: line fitting • Why fit lines? • Many objects characterized by presence of straight lines Adapted from Kristen Grauman 2019
Difficulty of line fitting • Extra edge points (clutter), multiple models: • which points go with which line, if any? • Only some parts of each line detected, and some parts are missing: • how to find a line that bridges missing evidence? • Noise in measured edge points, orientations: • how to detect true underlying parameters? Adapted from Kristen Grauman 2019
Voting • It is not feasible to check all combinations of features by fitting a model to each possible subset. • Voting is a general technique where we let each feature vote for all models that are compatible with it. • Cycle through features, cast votes for model parameters. • Look for model parameters that receive a lot of votes. • Noise and clutter features will cast votes too, but typically their votes should be inconsistent with the majority of “good” features. Adapted from Kristen Grauman 2019
Hough transform • The Hough transform is a method for detecting lines or curves specified by a parametric function. • If the parameters are p1, p2, … pn, then the Hough procedure uses an n-dimensional accumulator array in which it accumulates votes for the correct parameters of the lines or curves found on the image. b accumulator image m y = mx + b Adapted from Linda Shapiro, U of Washington 2019
Hough transform: line segments y b b0 m0 x m Image space Hough (parameter) space • Connection between image (x,y) and Hough (m,b) spaces • A line in the image corresponds to a point in Hough space • To go from image space to Hough space: • given a set of points (x,y), find all (m,b) such that y = mx + b Adapted from Steve Seitz, U of Washington 2019
Hough transform: line segments y b y0 x0 x m Image space Hough (parameter) space • Connection between image (x,y) and Hough (m,b) spaces • A line in the image corresponds to a point in Hough space • To go from image space to Hough space: • given a set of points (x,y), find all (m,b) such that y = mx + b • What does a point (x0, y0) in the image space map to? • Answer: the solutions of b = -x0m + y0 • This is a line in Hough space Adapted from Steve Seitz, U of Washington 2019
Hough transform: line segments y b (x1, y1) y0 (x0, y0) b = –x1m + y1 x0 x m Image space Hough (parameter) space What are the line parameters for the line that contains both (x0, y0) and (x1, y1)? • It is the intersection of the lines b = –x0m + y0 and b = –x1m + y1 Adapted from Steve Seitz, U of Washington 2019
c d r Hough transform: line segments • y = mx + b is not suitable (why?) • The equation generally used is: d = r sin(θ) + c cos(θ). d is the distance from the line to origin. θ is the angle the perpendicular makes with the column axis. Adapted from Linda Shapiro, U of Washington 2019
Hough transform: line segments Adapted from Shapiro and Stockman 2019
Hough transform: line segments Adapted from Kristen Grauman 2019
Hough transform: circles • Main idea: The gradient vector at an edge pixel points the center of the circle. • Circle equations: • r = r0 + d sin(θ) r0, c0, d are parameters • c = c0 + d cos(θ) d *(r,c) Adapted from Linda Shapiro, U of Washington 2019
Hough transform: circles Adapted from Shapiro and Stockman 2019
Hough transform: circles https://www.mathworks.com/help/images/ref/imfindcircles.html http://shreshai.blogspot.com.tr/2015/01/matlab-tutorial-finding-center-pivot.html http://docs.opencv.org/2.4/doc/tutorials/imgproc/imgtrans/hough_circle/hough_circle.html 2019
Hough transform: circles Zhao et al., “Oil Tanks Extraction from High Resolution Imagery Using a Directional and Weighted Hough Voting Method”, Journal of the Indian Society of Remote Sensing, September 2015 2019
Model fitting • Mathematical models that fit data not only reveal important structure in the data, but also can provide efficient representations for further analysis. • Mathematical models exist for lines, circles, cylinders, and many other shapes. • We can use the method of least squares for determining the parameters of the best mathematical model fitting the observed data. 2019
Model fitting: line segments Adapted from Martial Hebert, CMU 2019