Download
1 / 12
120 likes | 289 Vues
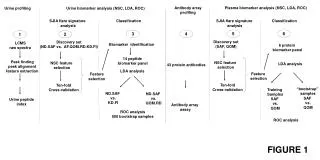
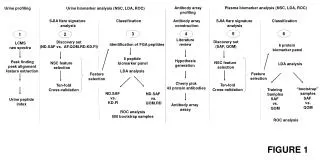
Antibody array profiling. Plasma biomarker analysis (NSC, LDA, ROC). Urine profiling. Urine biomarker analysis (NSC, LDA, ROC). SJIA flare signature analysis. Classification. Antibody array construction. SJIA flare signature analysis. Classification. 5. 6. 4. 3. 2. 1.

E N D
Antibody array profiling Plasma biomarker analysis (NSC, LDA, ROC) Urine profiling Urine biomarker analysis (NSC, LDA, ROC) SJIA flare signature analysis Classification Antibody array construction SJIA flare signature analysis Classification 5 6 4 3 2 1 Literature review Discovery set (SAF, QOM) Discovery set (ND.SAF vs. AF.QOM.RD.KD.FI) LCMS raw spectra Identification of FGA peptides 6 protein biomarker panel 6 peptide biomarker panel Hypothesis generation Peak finding peak alignment feature extraction NSC feature selection NSC feature selection LDA analysis LDA analysis Feature selection Feature selection Cherry pick 43 protein antibodies Ten-fold Cross-validation Ten-fold Cross-validation “bootstrap” samples SAF vs. QOM Training Samples SAF vs. QOM ND.SAF vs. KD.FI ND.SAF vs. QOM.RD Urine peptide index Antibody array assay ROC analysis 500 bootstrap samples ROC analysis FIGURE 1
Relative abundance AF.QOM.RD.KD.FI Protein MH+ Sequence ND.SAF -0.0004 -0.024 -0.0787 -0.1467 -0.0009 -0.0352 0.0015 0.0986 0.3225 0.6016 0.0037 0.1443 FGA(20-35) 1536.61 ADSGEGDFLAEGGGVR FGA(607-622) 1639.77 AGSEADHEGTHSTKRG FGA(605-621) 1826.80 DEAGSEADHEGTHSTKR FGA(605-622)1883.80 DEAGSEADHEGTHSTKRG FGA(605-628) 2560.2 DEAGSEADHEGTHSTKRGHAKSRP FGA(605-629)* 2659.24 DEAGSEADHEGTHSTKRGHAKSRPV TABLE 3
FGA peptide marker distribution FGA(605-621) 1826.80 FGA(20-38) 1536.69 FGA(605-622) 1883.80 FGA(607-622) 1639.77 Relative abundance FGA(605-629)* 2659.24 FGA(605-628) 2560.2 FIGURE 2 ND SAF QOM AF RD KD FI HC ND SAF QOM AF RD KD FI HC
A B C Classification ND SAF KD FI Clinical diagnosis ND.SAF KD.FI Sensitivity 2+18 23+23 n = Predicted probabilities LDA Predicted as SJIA F 14 1 Predicted as non SJIA F 6 45 Mean(AUC): 95.6% Percent Agreement with clinical diagnosis 70% 97.8% + - 89.4% Overall P = 6.7X10⁻⁹ 1- Specificity Patient samples FIGURE 3
A B C Classification ND SAF QOM RD Clinical diagnosis ND.SAF QOM.RD Sensitivity 2+18 18+9 n = Predicted probabilities LDA Predicted as SJIA F 13 2 Predicted As SJIA Q 7 25 Mean(AUC): 91.0% Percent Agreement with clinical diagnosis 65% 92.6% + - 80.9% Overall P = 6.1X10⁻⁵ 1- Specificity Patient samples FIGURE 4
I II III IV V VI VII TABLE 4
A B C D Training samples n = 39 Bootstrapping samples n = 52 Training Bootstrapping testing SAF QOM SAF QOM SJIA SJIA Clinical diagnosis Clinical diagnosis F Q F Q 25 14 41 11 n = n = LDA Testing Predicted probabilities Classified as F Classified as F 23 4 36 2 Classified as Q Classified as Q 2 10 5 9 92% 71.4% 87.8% 81.8% - - Percent Agreement with clinical diagnosis Percent Agreement with clinical diagnosis + + 84.6% 86.5% Overall P = 7.9X 10⁻⁵ Overall P = 2.4 X 10⁻⁵ Patient samples FIGURE 5
Sensitivity Sensitivity Training Bootstrapping testing Mean(AUC): 92.2% Mean(AUC): 90.7% 1- Specificity 1- Specificity FIGURE 6
A B C Training samples n = 47 Bootstrapping samples n = 24 Training Bootstrapping testing SAF QOM SAF QOM SJIA SJIA Clinical diagnosis F Q Clinical diagnosis ND.SAF QOM.RD 15 9 2+18 18+9 n = n = LDA Testing Predicted probabilities Classified as F Classified as F 13 2 7 1 Classified as Q Classified as Q 7 25 8 8 65% 92.6% 87.8% 81.8% - - Percent Agreement with clinical diagnosis Percent Agreement with clinical diagnosis + + 80.9% 86.5% Overall P = 6.1X 10⁻⁵ Overall P = 2.4 X 10⁻⁵ Patient samples FIGURE 5
Sensitivity Sensitivity Training Bootstrapping testing Mean(AUC): 90.8% Mean(AUC): 80.9% 1- Specificity 1- Specificity FIGURE 6