Download
1 / 1
10 likes | 120 Vues
Gas Temperature. Thermal Equilibrium G +L- L = 0 -> T gas (r). G : photoelectric heating on dust by FUV L : heating & cooling by collision between gas and dust particles L : cooling by line excitations. Chemical and Physical Structures of Massive Star Forming Regions.

E N D
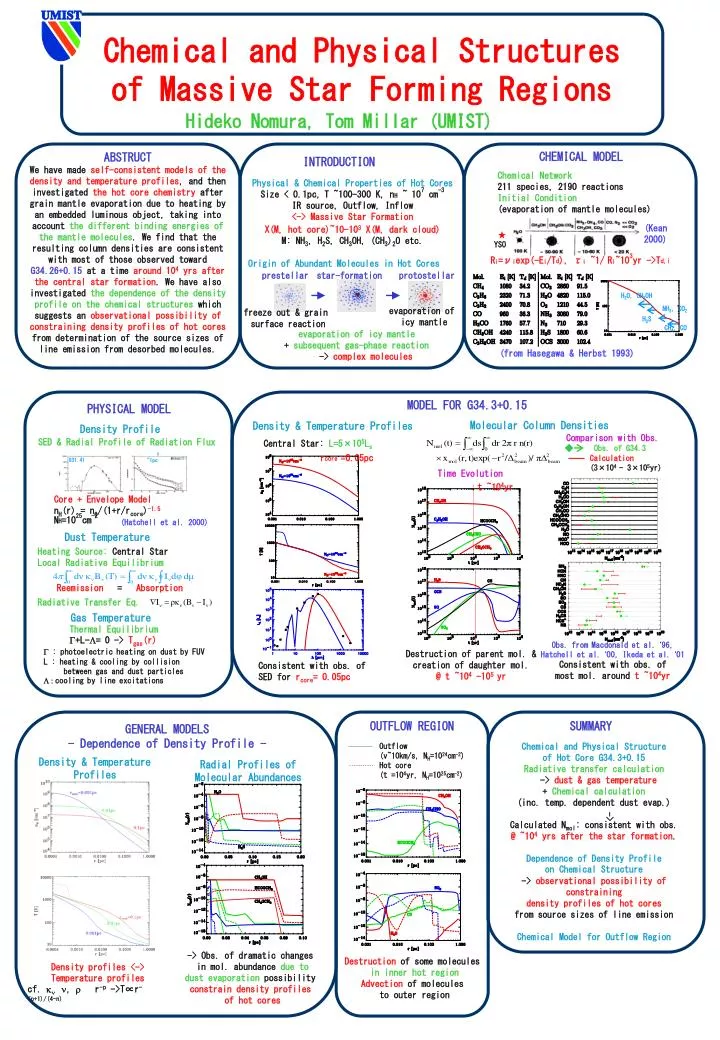
Gas Temperature Thermal Equilibrium G+L-L= 0 ->Tgas(r) G : photoelectric heating on dust by FUV L : heating & cooling by collision between gas and dust particles L : cooling by line excitations Chemical and Physical Structures of Massive Star Forming Regions Hideko Nomura, Tom Millar (UMIST) CHEMICAL MODEL ABSTRUCT We have made self-consistent models of the density and temperature profiles, and then investigated the hot core chemistry after grain mantle evaporation due to heating by an embedded luminous object, taking into account the different binding energies of the mantle molecules. We find that the resulting column densities are consistent with most of those observed toward G34.26+0.15 at a time around 104 yrs after the central star formation. We have also investigated the dependence of the density profile onthe chemical structures which suggests an observational possibility of constraining density profiles of hot cores from determination of the source sizes of line emission from desorbed molecules. INTRODUCTION Chemical Network 211 species, 2190 reactions Initial Condition (evaporation of mantle molecules) Physical & Chemical Properties of Hot Cores Size < 0.1pc,T ~100-300 K, nH ~ 107 cm-3 IR source, Outflow, Inflow <-> Massive Star Formation X(M, hot core)~10-103 X(M, dark cloud) M: NH3, H2S, CH3OH, (CH3)2O etc. H2O, CH3OH NH3, CO2 H2S (Kean 2000) CH4, CO ★ YSO Ri=νiexp(-Ei/Td), τi ~1/Ri~103yr ->Td,i Origin of Abundant Molecules in Hot Cores prestellar star-formation protostellar evaporation of icy mantle freeze out & grain surface reaction evaporation of icy mantle +subsequent gas-phase reaction -> complex molecules (from Hasegawa & Herbst 1993) PHYSICAL MODEL MODEL FOR G34.3+0.15 Molecular Column Densities Density & Temperature Profiles Density Profile Comparison with Obs. Central Star:L=5×10⁵Ls SED & Radial Profile of Radiation Flux Obs. of G34.3 V ~1pc Calculation (3×10⁴ - 3×10⁵yr) rcore =0.05pc G31.41 Time Evolution t ~104yr Core + Envelope Model nH(r) = n0/(1+r/rcore)-1.5 NH=1025cm-2 (Hatchell et al. 2000) Dust Temperature Heating Source: Central Star Local Radiative Equilibrium Reemission = Absorption Radiative Transfer Eq. OUTFLOW REGION Outflow (v~10km/s, NH=1024cm-2) Hot core (t =104yr, NH=1025cm-2) Obs. from Macdonald et al. ’96, Hatchell et al. ’00, Ikeda et al. ’01 Destruction of parent mol. & creation of daughter mol. @ t ~104 -105 yr Consistent with obs. of most mol. around t ~104yr Consistent with obs. of SED forrcore= 0.05pc SUMMARY GENERAL MODELS - Dependence of Density Profile - Chemical and Physical Structure of Hot Core G34.3+0.15 Radiative transfer calculation -> dust & gas temperature +Chemical calculation (inc. temp. dependent dust evap.) Calculated Nmol: consistent with obs. @ ~104 yrs after the star formation. Dependence of Density Profile on Chemical Structure -> observational possibility of constraining density profiles of hot cores from source sizes of line emission Chemical Model for Outflow Region Radial Profiles of Molecular Abundances Density & Temperature Profiles -> Destruction of some molecules in inner hot region Advection of molecules to outer region -> Obs. of dramatic changes in mol. abundance due to dust evaporation possibility constrain density profiles of hot cores Density profiles <-> Temperature profiles cf. kn n, r r-p ->T∝r-(p+1)/(4-n)